Widgets
Dashboards are composed of widgets that can display and collect data from users. TagoIO provides many widgets to handle your data in real time, from simple dials to tables, maps, videos, and forms that allow user input.
info
You can add up to 100 widgets in a single dashboard. This total includes widgets across all tabs. Each widget can display a maximum of 10,000 data points (variables).
Widget Categories
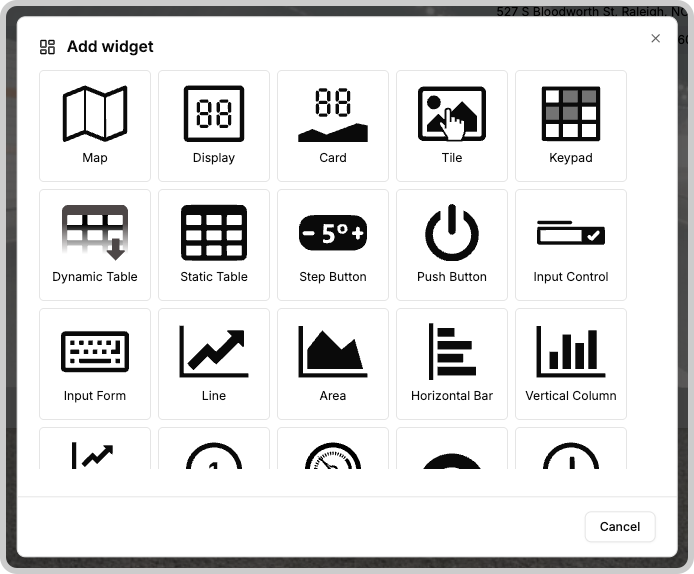
The following widgets are provided out of the box (icons and labels shown):
Chart Widgets
- Line Chart - Display data trends over time
- Area Chart - Filled area charts for data visualization
- Horizontal Bar - Horizontal bar charts
- Vertical Column - Vertical column charts
- Multiple Charts - Multiple chart types in one widget
- Pie Chart - Pie charts for proportional data
- Semi Pie - Semi-circle pie charts
- Semi Donut - Semi-circle donut charts
- Calendar Heatmap - Hour-by-day heatmap for time patterns and anomaly scores
Gauge & Meter Widgets
- Dial - Traditional dial gauges
- Angular - Angular gauge meters
- Solid - Solid gauge displays
- VU Meter - VU meter style gauges
- Cylinder - Cylindrical level indicators
- Grain Bin - Grain bin level visualization
Display Widgets
- Display - Simple value display
- Card - Card-style data display
- Tile - Tile-based data visualization
- Icons - Icon-based status display
- Clock - Time and date display
- Note - Text notes and annotations
Input Widgets
- Input Form - Data input forms
- Input Control - Control elements
- Keypad - Number input keypad
- Push Button - Action buttons
- Step Button - Increment/decrement buttons
Table Widgets
- Dynamic Table - Dynamic data tables
- Static Table - Static data tables
- Entity Table - Entity data tables
- Device List - Device listing widget
- User List - User listing widget
Map & Location Widgets
- Map - Interactive maps with device locations
- Heat Map - Heat map overlays
- Image Marker - Image-based location markers
Media Widgets
Widget Features
Common Features
Check the Widgets > General documentation for common features that can be used across almost all widgets.
Something missing from this page?