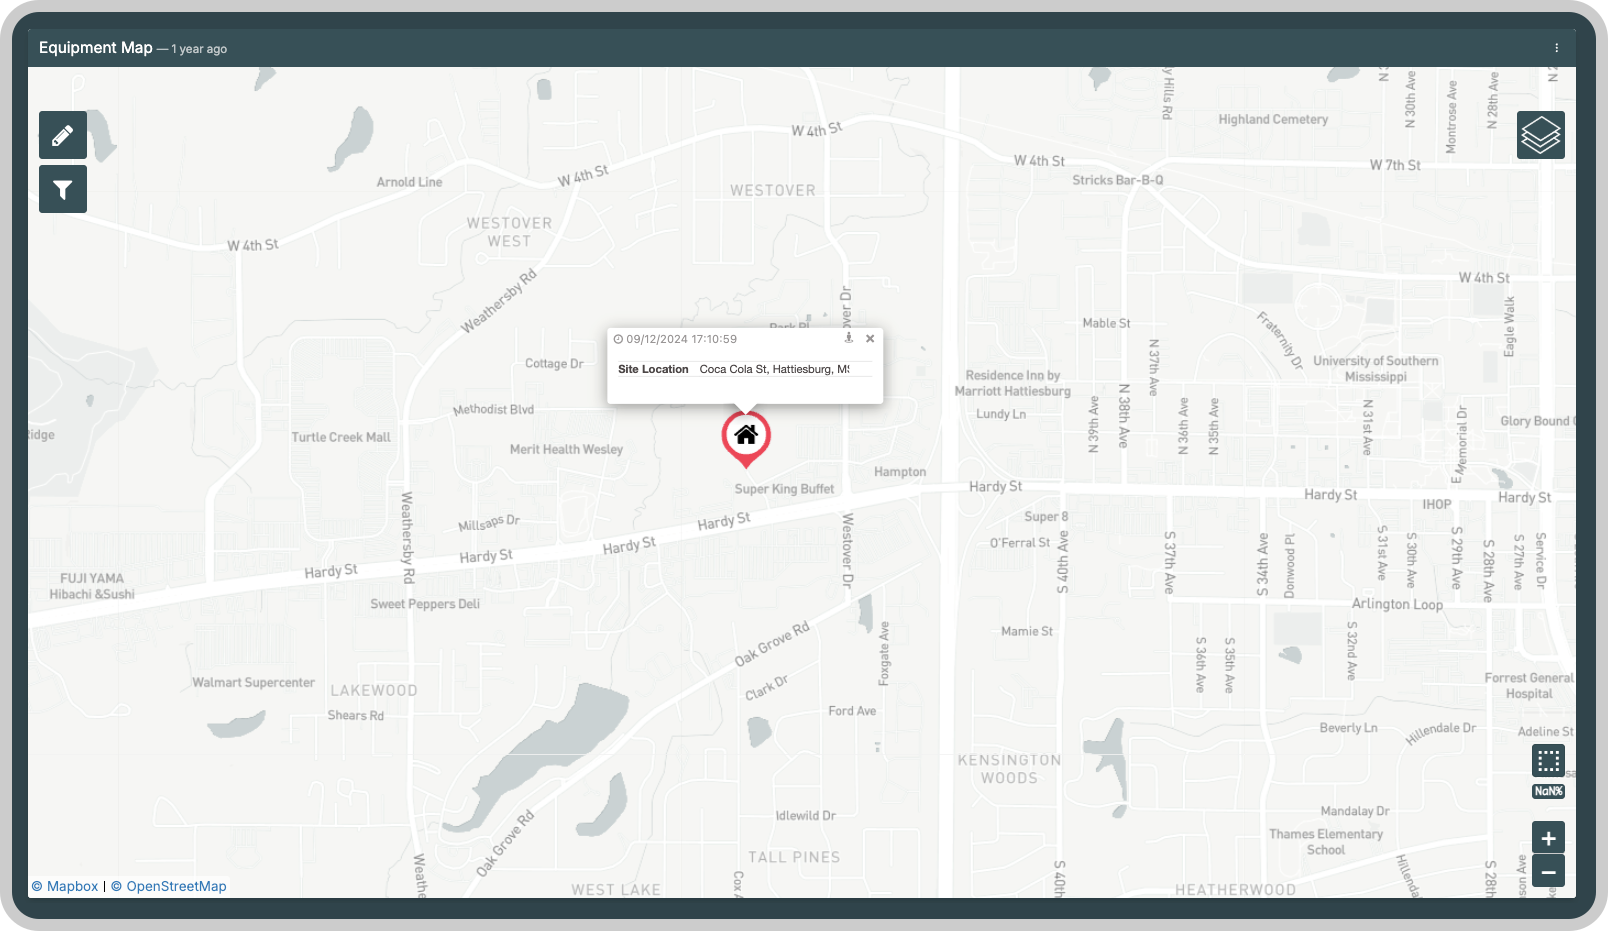
Map Widget
The Map Widget allows you to visualize the location variables of your device on a map, as well as customize the visualization in many ways. By default, the map widget uses OpenStreetMap as provider; however, you can integrate your preferred map provider like Mapbox, Google Maps, or Here to fit your needs.
Additionally, the widget allows you to customize the visualization by adding icons, pins, images, links, geofences, filters, and much more!
The variable must include a location field with your device's coordinates. TagoIO accepts both GeoJSON and { lat, lng } formats at ingestion. See Sending Data for format details and the coordinate order caveat.
{
  "variable": "location",
  "value": "My Address",
  "location": {
    "type": "Point",
    "coordinates": [-85.628292, 42.2974279]
  }
}
In GeoJSON, the coordinate order is [Longitude, Latitude], the opposite of the common lat/lng convention. Make sure your values are in the correct order.
This widget also accepts features like metadata and groups, that can be set in your variable data.
Creating your own
To add it to your dashboard, choose the Map widget from the list and customize it to your preference. You can edit it by using the options located on the right side of the widget.
1. 'Data Sources' Field
This field allows you to set the device and variable that will be used in this widget.
Click on the settings icon to edit specific options for this variable, such as: pin icon, formulas, and more. Click on the close icon to remove this variable from the widget's data.
This field is dependent on the type of dashboard you are using; the difference is explained below.
1.1 'Data Sources' for Normal Dashboards
From the option 'Data Sources' on the right menu, select one device from your list of devices and the variable that contains the location data.
1.2 'Data Sources' for Blueprint Dashboards
From the option 'Data Sources' on the right menu, add the Blueprint device and input the name of the variable that contains the location information.
When using a Blueprint dashboard, the field Variable will list variables to be picked using the first blueprint device it finds using the tags set for your Blueprint Device.
2. Tile Provider
This option allows you to define which map provider will be used on your widget to display the map. This is great if you need to have customized maps to fit your specific use case. By default, the map tile provider is OpenStreetMap, which is free to use; however, you can go with other providers like Mapbox, Here Maps, or Google Maps.
Each map provider has its own customization options for the tiles and pricing tiers, which often may be free up to a certain amount of tile requests. You should consult the providers to make an informed decision.
2.1 How to configure a map tile provider on TagoIO
To use one of the alternative map tile providers, you will simply need to have an API Key from your provider and a username in some cases. The API key can be found by accessing the console of your map provider. We suggest consulting the documentation of your provider if you have trouble getting the key.
Once the key is at hand, you will have to store the API key value inside a Secret on TagoIO. Go to your Admin, then the Secrets page, and create a new secret with the name of your map provider. In the Secret Value, paste the API Key and save.
Once you have a Secret with your API key created, you can go to your Map widget, then the Tile Provider option, select your map provider, and now in API Key, select the secret where the API key of your map provider is stored. Once you save the widget, the map will start displaying your provider's map and not the default.
2.2 How to configure Google Maps as map provider
For instance, using Google Maps as a provider is quite simple. All you need to do is have a Google account and set up an API Key. Read the full tutorial here: How to Set Up Google Maps in Your Map Widget
3. Infobox
Present more information with an infobox that'll automatically be associated with the pins, and customize it with icons, images, external links, street views, formulas, routes by GoogleMaps, and much more.
In the widget edit screen, you can customize the following options for the variables:
- Image options: Choose how the image will appear by selecting by top or side view and the perfect aspect ratio (portrait or landscape).
- Allow users to get directions: Create a button with another variable location data, so that once the button is pressed a new route is made by Google Maps and you are redirected to it.
Also, you can customize an image and a link that could be set through the edit screen or by metadata. In this widget, metadata always has priority over options set by the edit screen.
In addition, the map widget supports groups, so you can group your variables' data in the same infobox.
If a group of variables has more than one external link or location data, only one will be considered based on the Data Sources field's order. This does not apply to images, as more than one image will produce a slide show inside the infobox.
4. Filter
The filter makes your data easier to visualize by allowing users to filter for results.
You can filter pins by device, variable, value, and time. Filters also provide a table to list each pin that's being displayed, and you can click on a row to center it.
Learn more about Map filters.
5. Geofence
Draw colored geographic boundaries to make it easy to see your devices' trajectory through a zone.
You can draw polygon or circle figures and associate them with events, and build an analysis to receive notifications when the device enters or leaves the zone.
Learn more about Geofence in map widgets.
6. Layer GIS
Customize your Map with GeoJSON or Shapefiles layers. Display boundaries, areas, roads, pipelines, and more. Learn more about Map Layer GIS.
7. Managing Multiple Stationary Devices
When displaying hundreds of fixed sensors simultaneously (e.g., soil monitors, utility meters, parking spots), sending individual location variables from each device can be inefficient. A common strategy is to centralize all location data in a single virtual accumulator Device.
7.1 How it works
Instead of reading location variables from each physical device directly, you configure the Map Widget to read from a single accumulator device that stores a location variable per sensor. An Analysis or Action can be used to push each device's location into this central device whenever it changes.
This approach reduces the number of data sources the widget needs to query and keeps your dashboard performant as the number of devices grows.
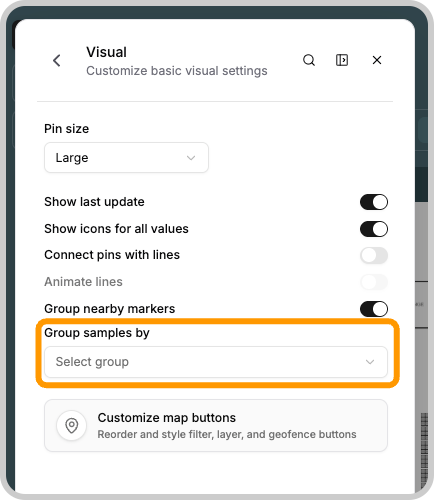
7.2 Grouping pins correctly
To display each data point as an independent pin rather than a moving trajectory, you need to configure how the widget groups samples. In the widget's Visual settings, the Group samples by option controls this behavior:
-
Date and Time (default): Each pin is treated as a separate marker based on its timestamp. For this to work correctly, each location variable sent to the accumulator device must have a distinct ISO 8601 timestamp in the
timefield.{"variable": "location","value": "Sensor B","time": "2024-06-01T10:00:00.000Z","location": {"type": "Point","coordinates": [-85.631, 42.299]}} -
Groups: Each pin is treated as a separate marker based on the
groupfield. Set thegroupfield to a unique identifier per sensor, such as the original Device ID.{"variable": "location","value": "Sensor A","group": "device-id-abc123","location": {"type": "Point","coordinates": [-85.628292, 42.2974279]}}