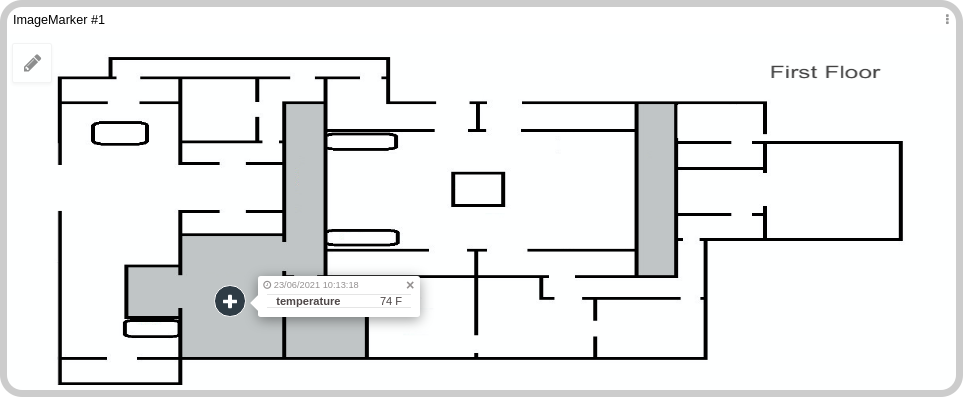
Image Marker Widget
The Image Marker widget places pins on custom images — floor plans, building maps, facility diagrams — and connects each pin to live or historical device data. It's the standard choice for indoor device tracking, where GPS isn't available and positions are defined relative to an image.
To use this widget you need at least two things:
- A pin data variable — the device variable whose value is shown on the pin (e.g., temperature, status).
- A layers variable — a variable that stores the floor plan image and the
x/yposition of each pin for each layer.
Optionally, you can also configure a geofence variable to store the boundaries users draw on the image.
How it works
- Add the Image Marker widget to a dashboard.
- Configure the Data From field with your pin data variables.
- Set a layer variable to store the floor plan image and pin positions.
- Use the editor to visually place pins on the image.
- Optionally, draw geofences to define zones.
Creating your own
To add the widget to your dashboard, choose Image Marker from the widget list. Configure it using the options panel in the edit panel.
1. 'Data Sources' Field
This field sets which device variables supply pin data.
Note: The Data From field supports up to 30 devices. To display more than 30 pins, use Advanced mode — configure a single device that stores each tracked device's position as a separate group. Each group becomes its own pin.
- Normal Dashboards — select a device and the variable that holds pin data.
- Blueprint Dashboards — add the Blueprint device and type the variable name. The selector may appear empty because the dashboard does not yet know which devices are linked to the Blueprint.
Layer Variable
Below the main Data From selector there is a "Variable used to store layers" field. Set it to the variable that holds the floor plan image for each layer. When a user uploads or replaces a floor plan image via the editor, the new image URL is written back to this variable automatically.
Geofence Variable
The "Geofence variable" field sets the variable where geofence boundaries are saved. When users draw polygons or circles in the editor, the shapes are written to this variable automatically. See Geofence for the full data format.
2. Basic vs. Advanced Mode
The widget has two modes. Both store pin positions identically in the layer variable — the difference is how the editor presents options when you assign a pin:
| Mode | Description |
|---|---|
| Basic | The editor shows the devices from the Data From field as pin assignment options. Each device gets one pin. Use this for simple setups where each physical device maps to one marker. |
| Advanced | The editor shows all occurrences of the selected variable that have different groups as options. Each group becomes a separate pin. Use this when a single device reports multiple positions or when you need more than 30 pins. |
3. Layer
A layer is a background image on which pins and geofences are drawn. You can have multiple layers — for example, one per floor of a building — each with its own set of pins.
Each layer has its own dedicated variable. In the widget configuration, you assign one "Variable used to store layers" per layer. That variable stores both the floor plan image URL and the current pin positions in a fixed_position map.
fixed_position key format
The key format in fixed_position depends on the mode:
- Basic mode — the key is the device ID alone.
- Advanced mode — the key is the device ID immediately followed by the group ID, with no separator. For example, if the device ID is
abc123and the group isxyz789, the key isabc123xyz789.
The fields you configure are inside the
metadataobject:fixed_position(pin positions) andfile(the floor plan image URL). System fields (id,time,created_at) are added automatically.
Basic mode — key is just the device ID:
{
  "value": "Layer #1",
  "variable": "layer",
  "metadata": {
    "fixed_position": {
      "<device-id>": {
        "device": "<device-name>",
        "label": "",
        "link_type": "image",
        "x": "0.49333079268292684",
        "y": "0.4043542074363992"
      }
    },
    "file": {
      "url": "<floor-plan-image-url>",
      "path": "<floor-plan-image-path>"
    }
  }
}
Advanced mode — key is device ID + group ID (no separator):
{
  "value": "Layer #1",
  "variable": "layer",
  "metadata": {
    "fixed_position": {
      "<device-id><group-id>": {
        "device": "<device-id>",
        "link_type": "image",
        "value": "<last-known-value>",
        "x": "0.5965083073727934",
        "y": "0.3530265748031496"
      },
      "<device-id><group-id>": {
        "device": "<device-id>",
        "link_type": "image",
        "value": "<last-known-value>",
        "x": "0.2943276220145379",
        "y": "0.26798720472440946"
      }
    },
    "file": {
      "url": "<floor-plan-image-url>",
      "path": "<floor-plan-image-path>"
    }
  }
}
Layers are managed at the top of the editor screen. The pencil icon opens a panel to rename the layer or replace its image. Dragging an image file onto the editor replaces the current layer's image.
Positioning pins
Pin positions are stored in the fixed_position map of the layer variable, not in the device variable itself. Coordinates are relative to the image dimensions: (0, 0) is the top-left corner and (1, 1) is the bottom-right corner. Think of them as percentages — x: 0.5 means the pin is at 50% of the image width.
You can set positions visually using the built-in editor without editing variable data directly. See Editor for details.
4. Editor
Changes only take effect after clicking Save. Closing without saving discards all changes.
The editor lets users place and adjust pins, manage layers, and draw geofences. It is enabled via the pencil icon in the top-left corner of the widget.
The toolbox contains four tools:
- Default tool — zoom and pan the image.
- Add tool — click on the image to place a new pin. The number of available pins is limited by the number of data entries.
- Edit tool — click an existing pin to change its variable, label, or icon.
- Delete tool — remove a pin.
Additional features
Infobox
Each pin has an infobox that opens when clicked. It shows the variable's value and can be customized with:
- Image — display a static or dynamic image alongside the data.
- External link — add a button that opens a URL.
- Formula — transform the displayed value using a math expression.
- Embedded widget — embed any dashboard widget inside the infobox.
Filters
Filters let users narrow down which pins are visible. You can filter by device, variable, or value. A table below the filters lists all visible pins — clicking a row centers the view on that pin.
Geofence
Geofences are colored boundaries (polygons or circles) drawn on the image. Use them to define zones and detect when a tracked device enters or leaves one. You can also trigger Actions based on geofence events, similar to geofences in the Map widget.
Before users can create geofences, you must configure at least one event in the Geofence Options tab of the widget settings. An event defines what trigger to associate with the geofence (for example, "enter" or "leave"). You can hardcode event options directly in the widget settings or supply them from a variable.
When using a variable, each entry represents one event option. The value field is the event identifier:
[
  {
    "variable": "event",
    "value": "enter"
  },
  {
    "variable": "event",
    "value": "leave"
  }
]
When enabled, the geofence tools appear in the upper-right corner of the editor:
- Draw polygon — click points to define a shape; click the first point to close it.
- Draw circle — click the center, then click again to set the radius.
- Edit tool — modify an existing polygon or circle.
- Delete tool — remove a geofence.
Each geofence is saved as its own separate entry in the geofence variable. The shape type determines the format of the coordinates field.
Circle geofence — coordinates is a single center point {x, y}, and radius is the size (both in the 0–1 range):
{
  "value": "Geofence #2",
  "variable": "geofence",
  "metadata": {
    "coordinates": {
      "x": 0.45642229087452474,
      "y": 0.3955462598425197
    },
    "radius": 0.09320854807801622,
    "type": "circle",
    "event": "enter",
    "eventDescription": "enter",
    "eventColor": "",
    "layer": "5rzZEJza2e0f4LNs7OuEp"
  }
}
Polygon geofence — coordinates is an array of {x, y} vertices:
{
  "value": "Geofence #1",
  "variable": "geofence",
  "metadata": {
    "coordinates": [
      { "x": 0.4145971958174905, "y": 0.058538385826771656 },
      { "x": 0.6275249524714829, "y": 0.08373523622047244 },
      { "x": 0.5666884505703422, "y": 0.19712106299212598 },
      { "x": 0.430756891634981, "y": 0.181373031496063 },
      { "x": 0.32619415399239543, "y": 0.09318405511811023 },
      { "x": 0.43360860266159695, "y": 0.06956200787401574 }
    ],
    "type": "polygon",
    "event": "leave",
    "eventDescription": "leave",
    "eventColor": "",
    "layer": "5rzZEJza2e0f4LNs7OuEp"
  }
}
Note: All coordinates are relative to the image dimensions (range 0–1), not geographic coordinates. The
layerfield references the layer this geofence belongs to using the variable group. SeteventColorto a hex value (e.g.,#ff0000) to color-code the geofence boundary; leave it empty to use the default color.