Building SCADA-style HMIs with Custom Widgets
When the level in a pump station keeps rising, an operator needs to know which pumps are running, whether water is leaving the station, and whether the readings are recent enough to act on. Showing that information together on a process diagram makes it easier to decide what to check next.
In a SCADA application, short for supervisory control and data acquisition, the human-machine interface (HMI) gives operators this view of the process and a way to request changes.
You can build that interface in TagoIO with a Custom Widget, supported by Analyses that process commands and evaluate alarms. TagoAI provides an easier starting point: it can create the widget, write the Analyses, and connect them. You can also write and configure these components yourself.
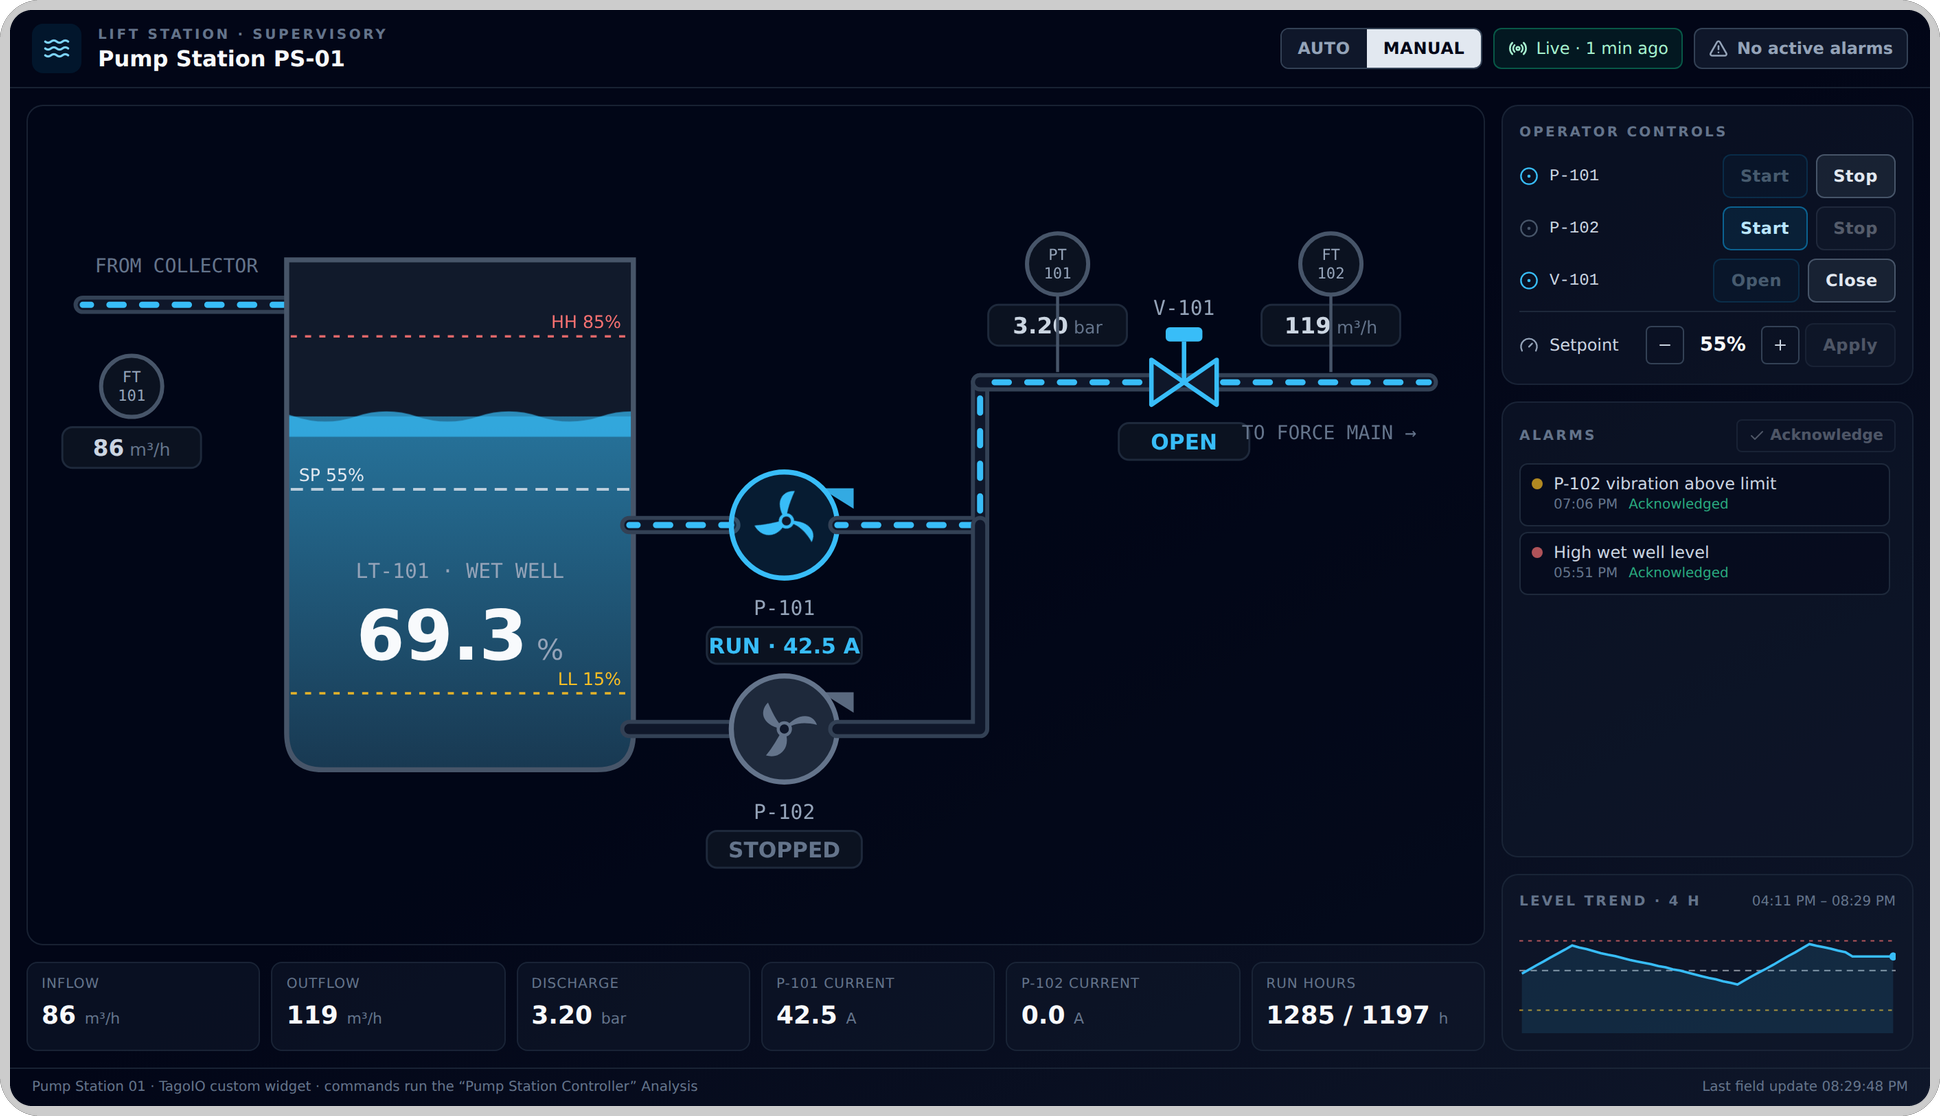
For this example, consider a station with two pumps drawing from a wet well, the tank that collects incoming water. The process diagram shows how the equipment connects; measurements, controls, alarms, and a short trend help the operator understand what is happening.
Before building your own screen, talk through a few situations with the person who operates the equipment:
- What should they check when the level rises?
- How can they tell whether a pump is moving water?
- When are remote commands permitted?
- What should they do if the station stops reporting?
Those answers determine the data and behavior your application needs. A pump can report that its motor is running without delivering flow, for example. If that distinction matters to the operator, the screen needs evidence of flow, not only motor status.
How it works
A TagoIO device holds the station's data. It represents the station in your application; writing a record to it does not, by itself, operate the physical equipment.
The Custom Widget reads that data and submits operator requests. An Analysis validates each request and sends the corresponding command through the station's integration.
Measurements and equipment feedback:
Field controller or gateway → TagoIO device data → Custom Widget

Operator commands:
Custom Widget → command record → Analysis → field controller or gateway
The field controller runs the local process. The widget shows what the field reports, including the result of an operator's request.
Keep these responsibilities separate:
| Component | Responsibility |
|---|---|
| Field controller or gateway | Report measurements and equipment states; receive supported commands. Local control and protection remain at the station. |
| TagoIO device data | Store telemetry, operator requests, and application records such as command results and alarm events. |
| Custom Widget | Display the process, explain abnormal conditions, and collect operator requests. |
| Analysis | Validate and route commands; implement application logic that needs code. |
| Actions | Trigger processing or notifications when data arrives, conditions are met, or a schedule runs. |
Command tracking and alarm acknowledgment are behaviors you implement for your application. A variable named alarm or pump_1_cmd does not provide those behaviors automatically.
Keep safety interlocks, emergency stops, and time-critical control in the field controller. A disabled button or a check in an Analysis cannot replace local protection. Decide how the station should operate when TagoIO or the network is unavailable.
Define what the station reports
Start with the data you can obtain from the controller or gateway. Confirm what each signal means before using it to drive the screen.
For example, a pump's reported status might represent a start request, a contactor output, or feedback from its drive. Those signals do not prove the same thing. Label the screen according to the evidence you actually have.
For the example station, you could use the following variables:
| Variable | Example meaning |
|---|---|
wet_well_level | Measured level, expressed as a percentage of the configured measurement range. |
discharge_pressure | Measured pressure, with an agreed unit. |
flow_rate | Measured discharge flow, with an agreed unit. |
pump_1_state, pump_2_state | Reported equipment state, such as running, stopped, or fault. |
station_mode | Reported control mode, such as auto or manual. |
control_location | Whether control is assigned locally or remotely. |
level_high_alarm | The application's high-level alarm threshold, in the same unit as wet_well_level. |
pump_1_cmd, pump_2_cmd | Operator requests, such as start or stop. |
These are application-specific names and values. Adapt them to your equipment, and document their types, units, allowed values, and source.
One TagoIO device per station is a simple starting point when the station's data arrives together. If your integration already uses separate devices for pumps, tanks, or sensors, keep that structure and make each data binding explicit.
Keep requested settings separate from applied settings, just as you keep commands separate from equipment states. If an operator requests a new setpoint, show the value accepted by the controller once it reports back.
Make the age and quality of data visible
A stored value remains available after communication stops. Without a freshness check, the screen can continue showing a pump as running long after its last report.
For each critical signal, agree on:
- Its expected reporting interval, or whether it reports only when it changes.
- How the application detects loss of communication.
- How sensor faults and invalid readings are represented.
- When the screen should mark the value as stale.
Show missing values as unavailable, not as zero or a stopped pump. For stale values, keep the last reading visible with its timestamp and a clear stale indication.
Continue checking data age when no new records arrive. Command submissions and alarm acknowledgments must not refresh the apparent age of field telemetry.
If equipment reports states only when they change, you may need a periodic status report or heartbeat to assess communication. A gateway heartbeat confirms communication with the gateway, but does not necessarily confirm that every connected sensor is healthy.
Also check how timestamps are assigned. An old sample uploaded after an outage should not appear to be a fresh measurement.
Design the command path before adding buttons
Consider what should happen when an operator selects Start Pump 1.
- The widget identifies the target and asks for confirmation. Show the station, equipment, and requested operation. This is especially important when the same dashboard serves several stations.
- The widget submits a request. Store
pump_1_cmdwith the requested value and show that the request is awaiting a result. Keep the last reported pump state visible. - The Analysis validates the request. Check the target station, supported command, authorization, relevant data freshness, and operating constraints.
- The Analysis sends the field command. Use the command format and delivery method supported by the controller or gateway.
- The field reports the outcome. Update the equipment display from this feedback. If the controller rejects the request or reports a fault, show that result and its reason.
A successful API call or downlink submission confirms only that stage of delivery. It does not prove that the pump started.
Connect the request to an Analysis
You can ask TagoAI to create a command-handling Analysis and connect it to the Custom Widget. Provide the command variables, allowed values, validation rules, and the command format your gateway expects.
If you are building manually, create the Analysis yourself and select it in the widget's Run analysis when sending data field. The widget uses sendData to submit the request; the associated Analysis processes the submitted data.
For either approach, check the association and include every variable the widget reads or writes in its Data sources, including command and acknowledgment variables. A write to a variable absent from that configuration is dropped without an error. See the Custom Widget configuration for data sources and the Analysis association.
Keep gateway credentials and command delivery on the backend, outside the widget's browser code. Choose an Analysis runtime that supports the integration you need.
The field integration determines how delivery works. For a LoRaWAN example, see Downlinks using Dashboards. Account for the device's receive opportunities when deciding how long the application should wait.
Define rejection, timeout, and retry behavior
The widget needs a way to read command results, not only equipment states. Have your application record rejected requests and delivery errors so the operator sees more than a pending indicator.
Set the confirmation timeout from the expected command-delivery and feedback intervals. If it expires, show the outcome as unconfirmed. The equipment may have acted even though its feedback was lost, so an unconfirmed result should not automatically cause another command.
Where the field protocol supports it, use a request identifier to associate a response with its command. Fresh state feedback can establish that the pump is now running, but it may not establish which request caused it.
Define how the backend handles repeated, expired, and conflicting requests. Hosted Analyses can execute concurrently, so do not assume two operator requests execute in the order they were submitted.
Explain why a control is unavailable
AUTO/MANUAL and LOCAL/REMOTE answer different questions. A station can be running its automatic sequence while still allowing remote setpoint changes. A manual mode does not necessarily grant remote control.
Use the station's actual operating rules to decide which requests are permitted. When a control is disabled, explain why, for example: "Pump control is assigned to the local panel."
Check those rules again in the command handler and field controller. The station may change mode after the widget displays its last update.
Give alarms a lifecycle
An alarm should identify a condition that requires attention and help the operator decide what to do. "Wet-well level high" is more useful when accompanied by the current level, the alarm threshold, when the condition started, and the expected response.
Agree on alarm priorities and responses with the people responsible for the process. Avoid treating every unusual reading as an alarm.
For a high-level condition, the application needs to distinguish at least these situations:
| Situation | Expected behavior |
|---|---|
| Level enters the alarm condition | Create a new alarm occurrence and show it as active and unacknowledged. |
| Operator acknowledges it | Record the acknowledgment. Keep the alarm active while the level remains high. |
| Level returns to normal | Record the return to normal. Preserve the occurrence in history. |
| Level becomes high again later | Create a new occurrence with its own acknowledgment state. |
If an alarm clears before anyone acknowledges it, decide whether it remains in a returned-to-normal, unacknowledged list. Make that behavior consistent across the application.
Acknowledgment records that someone has seen an alarm. It does not clear the process condition, reset a fault, or authorize a restart.
Evaluate alarms independently of the screen
If the controller already reports authoritative alarms, use those reports as the source for their state.
For alarms calculated in TagoIO, use Actions to run an Analysis when relevant telemetry arrives. Use a scheduled Action for conditions such as missing telemetry, which must be detected even when no new record arrives.
Persist the current alarm state and its events so the widget can reconstruct the correct display after a reload. Alarm detection, history, and notifications must continue when nobody has the dashboard open.
For a noisy measurement, define a separate return-to-normal threshold, called hysteresis, or an appropriate delay. Otherwise, a value moving around one threshold can repeatedly activate and clear the alarm. Choose those settings with the process owner rather than applying a generic delay.
Store enough context to understand what happened
You can use variables such as alarm and alarm_ack for application records, but define their contents and interpretation explicitly.
An alarm history should let you identify the station, equipment, condition, occurrence, priority, and transition time. An acknowledgment should identify the specific occurrence or occurrences acknowledged, the time, and a verified operator identity.
Do not infer acknowledgment solely from "all events older than this timestamp" unless that is the deliberate operator action. An operator should not accidentally acknowledge an alarm they have not seen.
Configure notification Actions from the recorded alarm transitions. Decide who receives each priority and when reminders or escalation are needed. Avoid sending a new notification for every telemetry sample while the same alarm remains active.
Keep alarm evaluation separate from command delivery. An alarm check or acknowledgment must not accidentally resend an equipment command. Also check that records written by an Analysis do not repeatedly trigger that same Analysis through an Action.
Build and connect the application
Once you have defined the station data and operating rules, you have enough information to start implementing the application.
TagoAI is the recommended starting point if you want help creating the code and connecting the resources. Ask it to build the Custom Widget and supporting Analyses from the requirements you established above. Include:
- The equipment connections and variable definitions.
- Which controls submit requests and which Analysis handles them.
- What counts as confirmed operation and how command results reach the widget.
- How stale data appears and which conditions prevent a command.
- The alarm lifecycle, including acknowledgment and return to normal.
A screenshot can help communicate layout, but it cannot supply these rules. The Building Custom Widgets with TagoAI guide covers setup, prompting, refinement, and inspection of the generated widget.
If you prefer to write the code yourself, use the Custom Widget Development Skill for implementation requirements and SDK usage, and the Analysis documentation for scripts, runtimes, and permissions. Configure the widget's data sources and Analysis association yourself. The application design and tests remain the same.
Build in stages
Use a test dashboard and a separate test device, with no route to live command delivery.
- Build the display first. Load known measurements, equipment states, and history. Verify the data bindings, units, timestamps, missing-data behavior, and layout.
- Add commands with simulated feedback. Create the controls and command-handling Analysis, then connect them. Exercise validation, rejection, pending, and unconfirmed outcomes before integrating real equipment.
- Add alarm processing. Implement evaluation and acknowledgment, then configure the Actions that trigger background checks and notifications. Verify the behavior with the dashboard closed.
- Connect the field integration under controlled conditions. Replace simulated delivery and state updates with the approved command integration and field feedback.
You can ask TagoAI to implement each stage, write it yourself, or combine both approaches.
Review the connections as carefully as the code. The values submitted by the widget must match what the Analysis accepts, and the result records must match what the widget reads. Check Analysis permissions and Action triggers as well. A screen that looks correct can still be connected to the wrong device or script.
Arrange information around the operator's task
For the pump station, keep the level, pump states, discharge conditions, and active alarms visible together. Put less frequently used settings and detailed history elsewhere on the dashboard.
A few design choices make the screen easier to use:
- Use a simplified process diagram. Show the connections needed to understand operation. You usually do not need to reproduce every detail of an engineering drawing.
- Keep normal operation visually quiet. Use consistent state labels and reserve prominent colors for conditions that need attention. Color must not be the only indication.
- Animate only what the data supports. A running motor does not prove flow through every connected pipe. Stop presenting animation as live when its supporting telemetry becomes stale.
- Place controls beside their context. Keep the target equipment and relevant feedback visible during confirmation and while a request is pending.
- Design for the actual display size. Check labels, touch targets, contrast, and alarm visibility at the sizes your operators use.
Use trends to explain the current condition
A level reading tells the operator where the process is now. A short trend helps them see whether it is rising, falling, or responding after a pump starts.
Show the main process variable with relevant limits and, where applicable, its setpoint. Make gaps in reporting visible rather than presenting missing periods as continuous measurements.
Configure enough records in the widget to cover the intended time window at the station's reporting rate. Verify the displayed period using actual timestamps; a record count alone does not guarantee a duration.
For longer investigations, place a native Line Chart below the HMI instead of loading all historical data into the process diagram.
Reuse the design across stations
Use a Normal dashboard for a fixed station, or a Blueprint dashboard when the same layout serves multiple stations.
For Blueprint dashboards, bind the widget's data sources to the appropriate blueprint slot. Stations sharing a layout need consistent variable names, units, and state meanings. Keep station-specific limits and configuration associated with the selected station.
Show the station identity prominently, including in command confirmations. On a station change, ensure that the widget clears the previous station's displayed values and local pending indicators while loading the new selection. Changing stations must not cancel or retarget a request already submitted.
For operators using TagoRUN, configure Access Management for the dashboards and resources they need. Blueprint filters select devices; they do not grant access.
Define who may monitor, acknowledge alarms, change setpoints, and operate equipment. Enforce authorization in the backend, not only in the interface, and grant each Analysis only the resource permissions it needs.
Test the situations operators will encounter
Keep simulation disconnected from live command delivery. An Input Control widget can help submit test states and measurements; check that submitted values have the types your application expects. A simulator can also produce feedback, provided it is clearly separated from the production integration.
Test more than the normal start-and-stop sequence:
| Test | What to verify |
|---|---|
| A pump reports running but measured flow remains low | The display does not imply healthy flow. Any configured process alarm follows its approved rule. |
| A request is rejected or feedback never arrives | The reason or unconfirmed outcome is visible. The widget does not fabricate a running state or retry automatically. |
| Telemetry stops while the dashboard is open | Readings become stale, live animation stops, and controls follow the stale-data policy. |
| An alarm activates while the dashboard is closed | Evaluation, event recording, and notifications still occur. |
| An alarm is acknowledged, then the page reloads | Acknowledgment remains recorded, and an active condition remains visible. |
| Two operators submit requests close together | The backend handles conflicts and repeated requests according to the defined policy. |
| The operator switches Blueprint stations | Readings, limits, alarm history, and new commands belong to the selected station. |
| A read-only operator signs in | They can monitor permitted stations but cannot issue unauthorized requests. |
Before connecting real equipment, review the command path and operating rules with the person responsible for the station. Remove simulated state writes from that path, verify the field feedback, and test command outcomes through the actual integration under controlled conditions.
Keep the test dashboard for future changes. Whether you edit the code yourself or ask TagoAI to update it, repeat the command, alarm, and station-selection tests and check the layout.