Building Custom Widgets with TagoAI
Use TagoAI to build a Custom Widget from a written description. Describe what you want users to see and do; TagoAI can create the widget and its code. This tutorial covers what to put in the prompt and how to check the result against your device data.
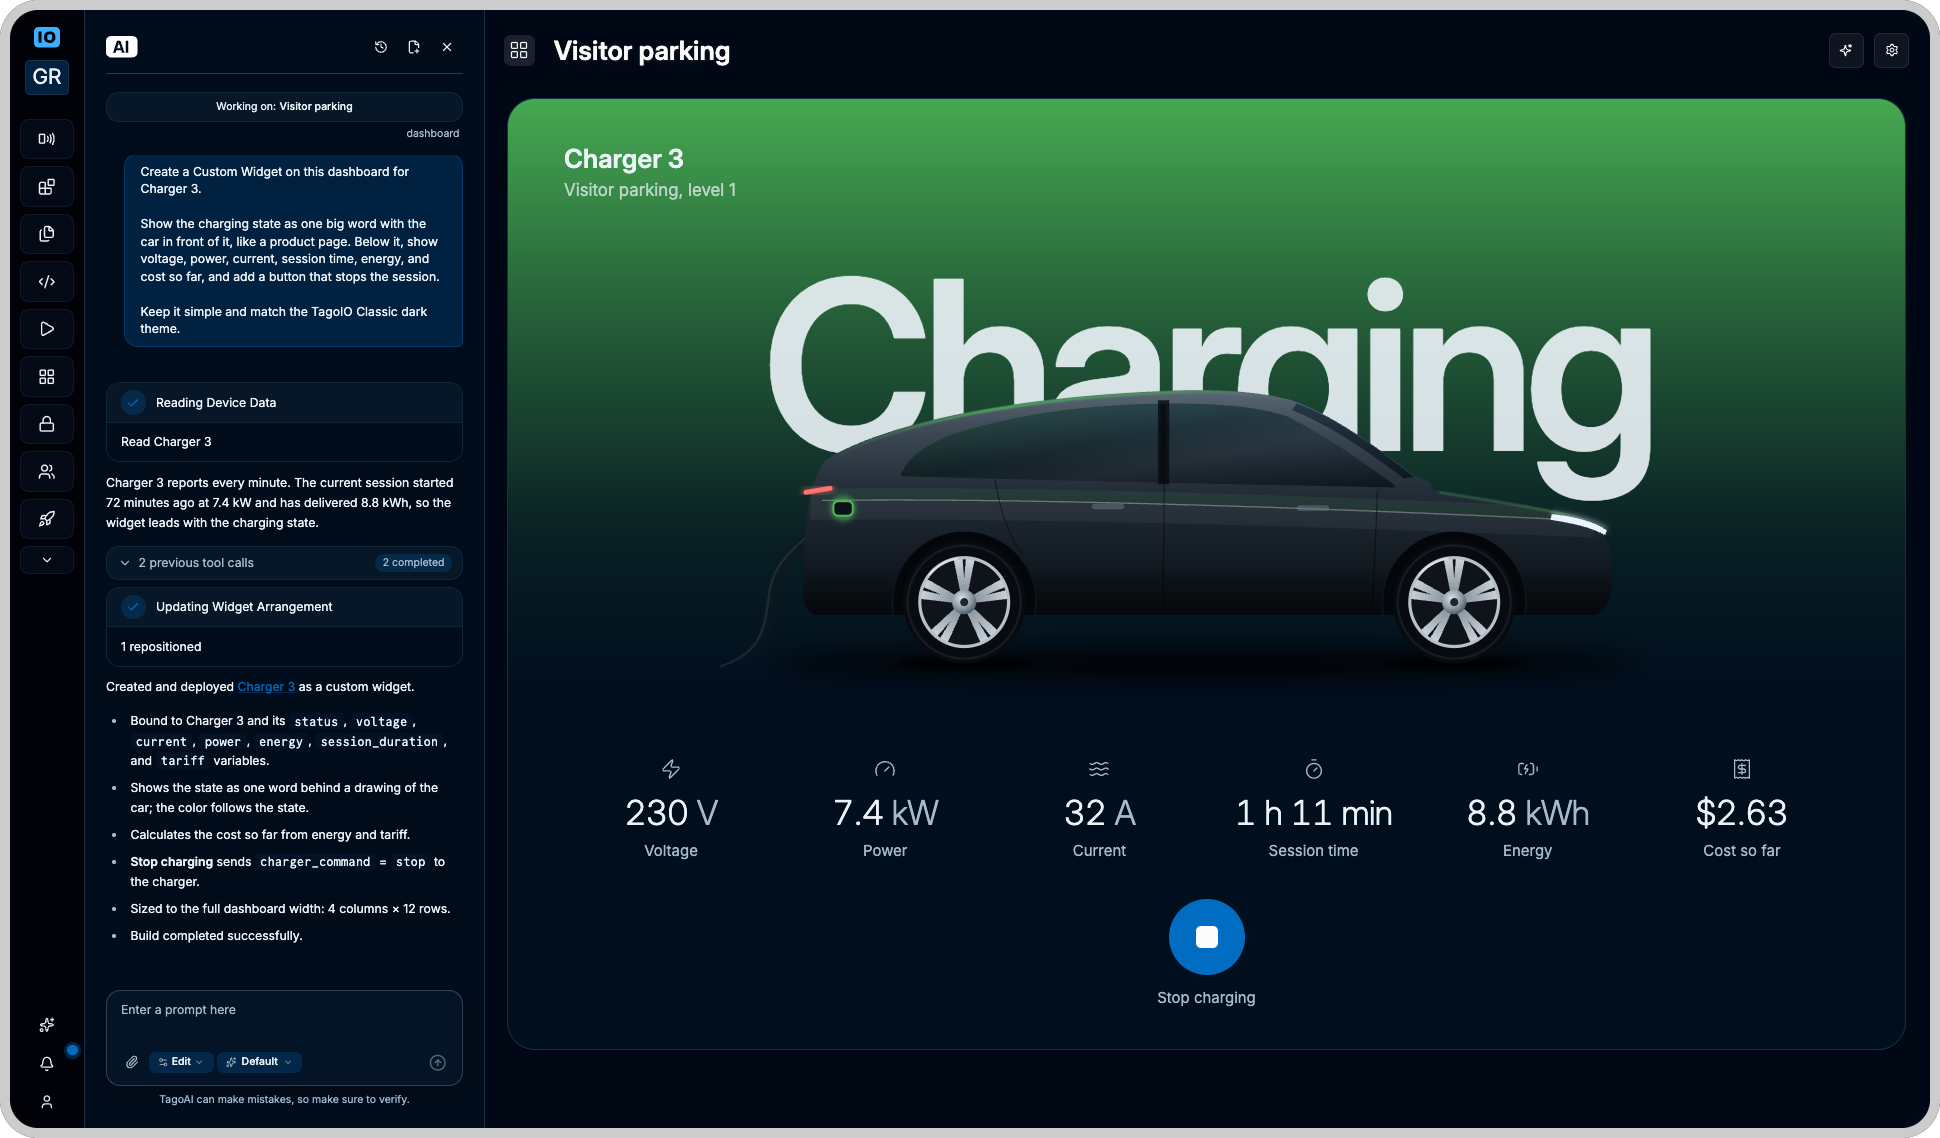
This EV charger widget shows the current charging session, with a button to stop or start charging. The example prompt near the end of this guide describes it.
Before you start
- Make sure TagoAI is enabled for the profile under Profile Settings → Services → AI Provider. On profiles in the EU region, it is off by default. See TagoAI for models, AI Credits, and providers.
- Review TagoAI Chat to choose a model and a permission mode appropriate for creating or editing resources.
- Have a Normal or Blueprint dashboard ready, along with the device data you want to display.
For this walkthrough, use a test dashboard and a device with temperature and door-state data. Replace the example names and values with those from your application.
1. Define the result
Before asking TagoAI to build anything, decide:
- Purpose: What should someone understand or do with this widget?
- Data: Which device or blueprint slot and which variables should it use?
- Layout: What information matters most, especially on mobile?
- Interactions: Is it display-only, or should users be able to submit changes?
- Missing data: What should appear when a value is unavailable?
Start with a display-only widget. Review its data and layout before adding controls.
2. Ask TagoAI to create the widget
Open your dashboard in the Admin, then open TagoAI from the dashboard. This gives the chat context about the dashboard you are viewing.
Explicitly ask for a Custom Widget and describe the expected result:
Create a Custom Widget on this dashboard for the device Cold Room 4.

The widget should help an operator check the room's temperature
and whether its door is open.

Use:
- temperature, in °C
- door_state, with values open or closed

Show:
- The latest temperature as the main value, with its timestamp.
- Door state as a clearly labeled badge.
- A temperature chart covering the last 24 hours, where data
  is available.

Use a compact layout with the current values above the chart.
On mobile, stack the content without horizontal scrolling.

Show "No data available" for missing values rather than displaying
zero or assuming the door is closed.

Do not add controls yet.
For a Blueprint dashboard, name the intended blueprint slot in your prompt. See Blueprint Dashboard for device-selection and configuration guidance.
3. Review the first version
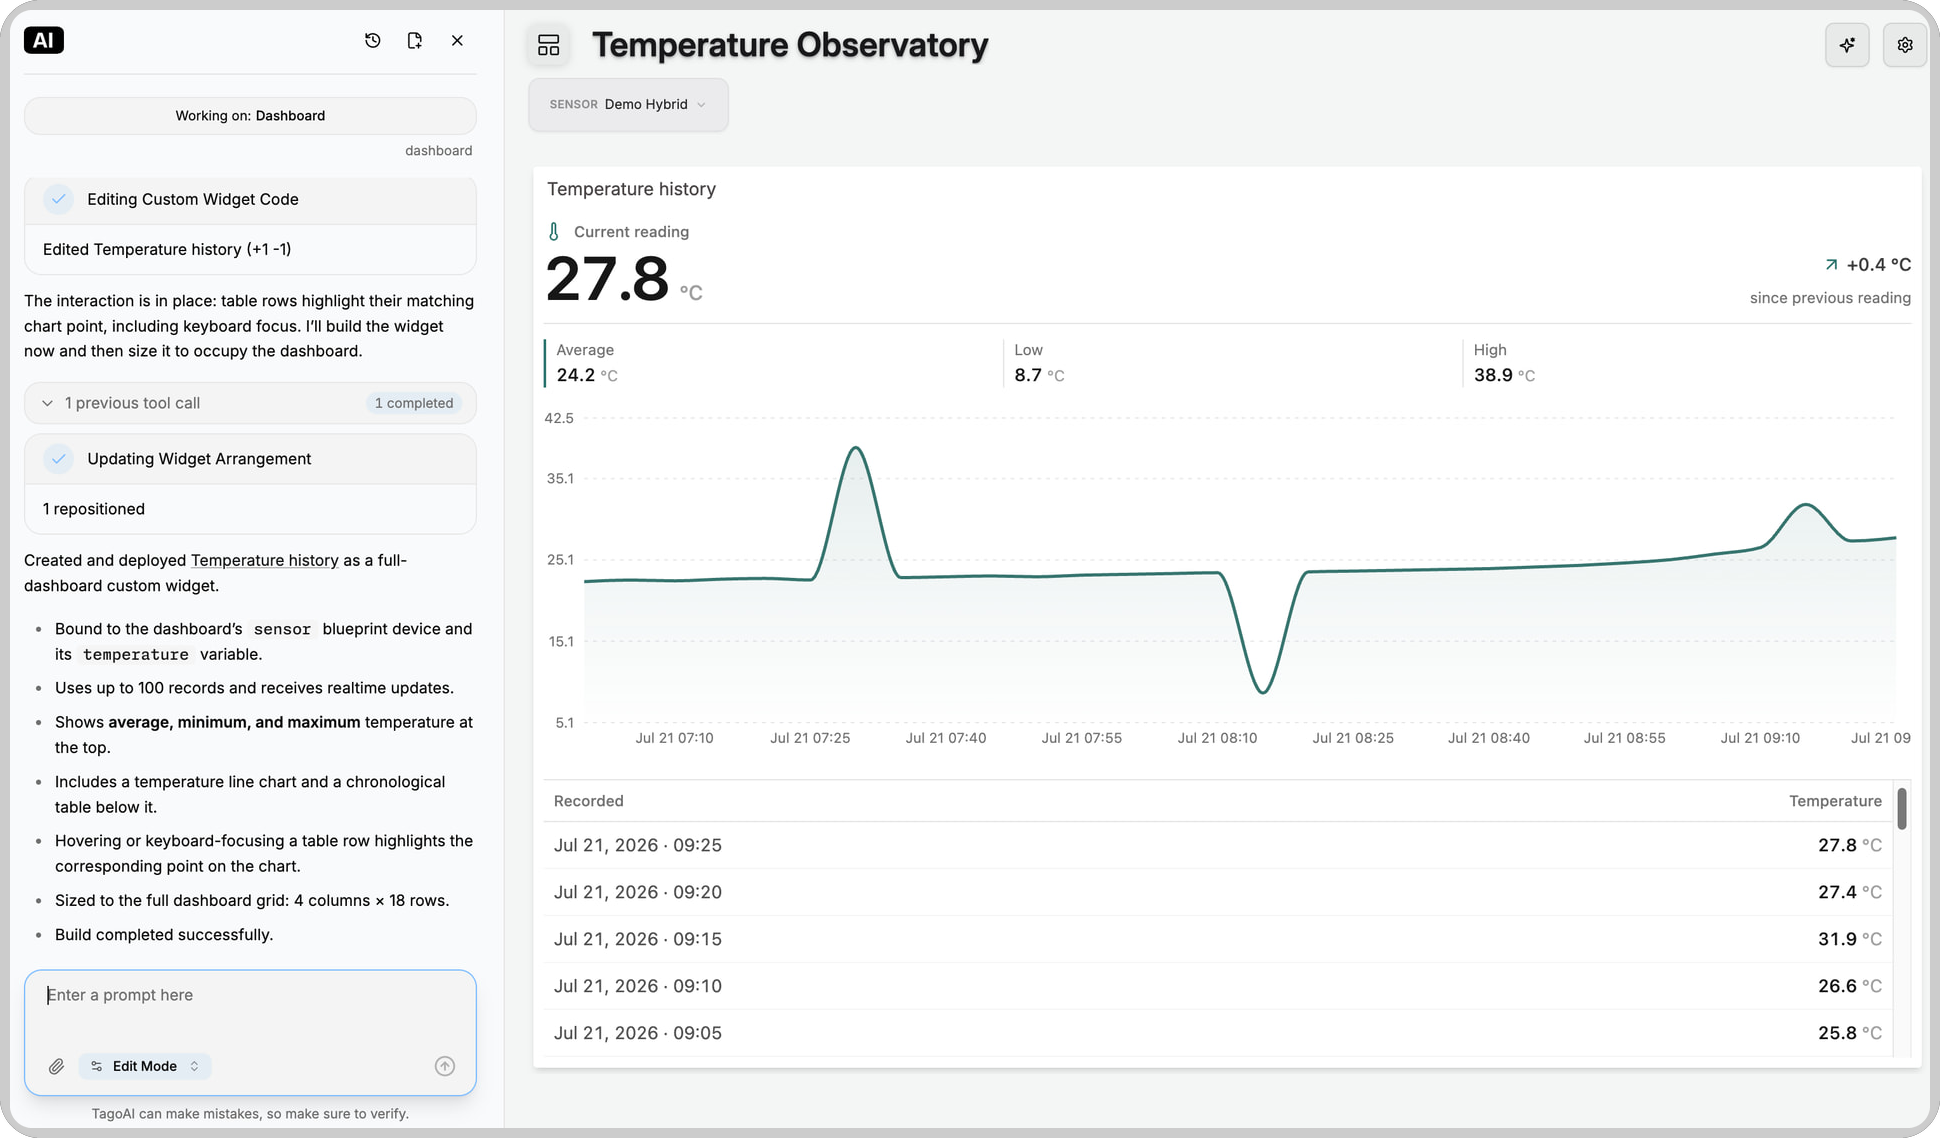
For example, after building this temperature history widget on a Blueprint dashboard, TagoAI summarized the result in the chat, including the blueprint slot and variable it used, the number of records, and the widget size.
Compare the result with your requirements and actual device records:
- Does TagoAI's summary in the chat match your request, including the data binding, the number of records, and the widget size?
- Do the displayed values, units, and timestamps match?
- Does the chart show the intended period? If not, is the available history clear?
- Can users identify the most important information without scrolling?
- Is the widget readable at its actual desktop and mobile sizes?
- Are missing values distinguishable from valid readings?
- On a Blueprint dashboard, does each entry in the widget's Data sources use the blueprint slot rather than a fixed device?
Do not judge the result only by its appearance. Check the data before refining the design.
If something is wrong, describe the expected and actual behavior. To get a diagnosis without changes, switch to Read Only first, because Edit Mode can apply changes without asking:
The latest temperature matches the device data, but the chart only
shows about one hour. I requested 24 hours.

Check the available history and the widget configuration. Explain
what is limiting the displayed period before making changes.
4. Refine with focused requests
Ask for one related set of changes at a time. State what should remain unchanged:
Keep the existing values, chart, and data sources.

On mobile, move the door-state badge below the temperature and
reduce the timestamp size. Keep both current values visible
above the chart.
After each revision, check both the requested change and the features that should have stayed the same.
If you add controls, specify the device and variable each control writes, allowed values, confirmation step, and expected feedback. The variable must be one of the widget's data sources; otherwise the write is dropped without an error. Test controls with a non-production device before relying on them. To route commands through an Analysis and confirm them from field data, see Building SCADA-style HMIs with Custom Widgets.
5. Validate for your users
Before sharing the dashboard with users:
- Test desktop and mobile layouts.
- Check missing, incomplete, and unexpected data.
- For Blueprint dashboards, test several device selections.
- Test every control and verify its actual outcome.
- If TagoRUN users will open the dashboard, test it signed in as one of them.
- Review generated code and configuration as you would any other application change. The generated source is a
.tsxfile in the profile's Files, and its address appears in the widget's URL and parameters section.
Example: EV charger widget
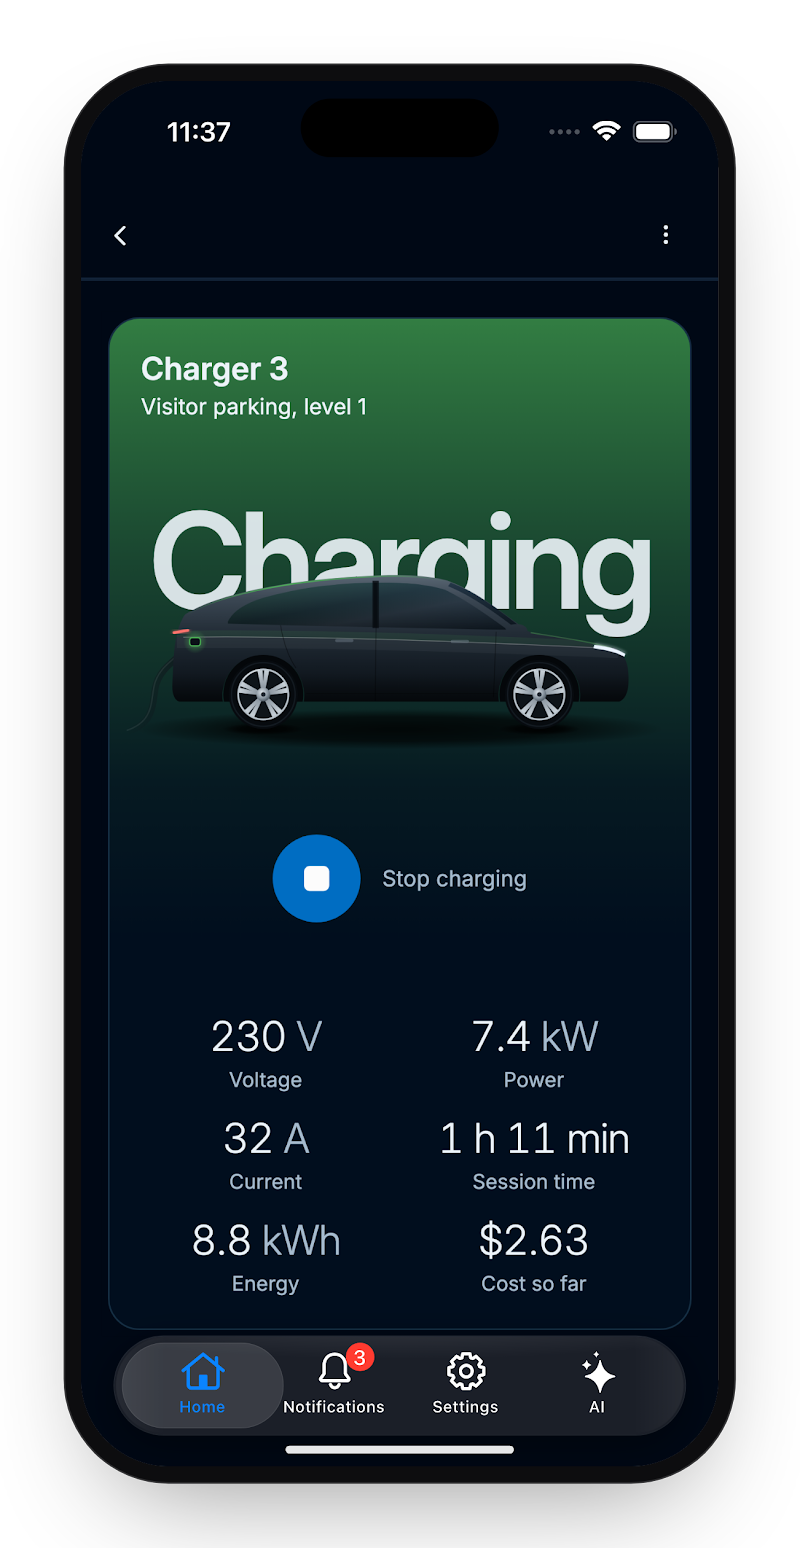
Once you know the data, look, states, and controls you want, you can describe them in one prompt. The prompt below describes the EV charger widget above. It also covers missing data, an offline charger, the variable each button writes, and the layout from phone to desktop widths.
Build a custom widget for one EV charger in a simple, Apple-like
style: one idea, one hero, generous space, no chart clutter.

Data
- Device: the device bound to this widget. Read its name and its
  "location" tag from the device resource.
- Variables, newest record of each: status (available, charging,
  finished, fault), voltage (V), current (A), power (kW), energy
  (kWh, this session), session_duration (seconds), tariff ($/kWh).

Look
- Dark rounded card: background #010E1E, 1 px border #163045, radius
  28 px (24 on medium widths, 20 on phones), Inter font, text
  #ECF3F8, secondary text #A5BACD.
- A soft wash of the state color (green #4DB956 Charging, blue
  #3B99E2 Finished, teal #47A0B5 Available, coral #FD736D Fault,
  grey #A5BACD Offline) across the top, fading out toward the
  middle. Text keeps 4.5:1 contrast on every wash.
- Hero: the state word, very large and light (weight 300), with a
  clean side view of the car and its cable drawn over it. The ground
  shadow is a gradient.
- Six stats: Voltage, Power, Current, Session time, Energy, and Cost
  so far (energy × tariff, in USD). Each is a large light number
  with a small label and unit.
- One round button, Stop charging or Start charging, with its label
  beside it, or under it on tall widgets.

States
- No report for 75 minutes: "Offline", grey wash, and a
  "No report for N h" chip. Hide the button and show
  "Commands are paused while <device name> is offline."
- No data: "No readings from <device name> yet."
- Any other status value: "Unknown" in grey.

Commands
- Stop charging writes charger_command = "stop" while charging.
  Start charging writes charger_command = "start" while finished.
- After a tap, show "Stopping the session" or "Starting the session"
  and keep the button busy until status reports the new state.
- When no button applies, put the status message in its place, so
  the layout never shows an empty gap.
- No reply in 10 seconds: "No reply from TagoIO. Try again." No
  confirmation in 20 seconds:
  "No confirmation from <device name> after 20 seconds. Try again."
  A refused write: "TagoIO did not store the command: <reason>".
  Enable the button again after each one.
- Status messages go to one polite live region, and errors use
  role="alert".

Responsive, phone first
- On phones the order is header, car, button, then stats in 2
  columns (3 columns on short widgets). Medium widths use 3 columns,
  or all 6 in one row from 720 px wide when the widget is not tall.
  Wide widths use 6 in a row.
- Tap targets are at least 56 px on phones, or 48 px when the widget
  is short, and at least 16 px apart.
- Use container queries on the widget: compact under 480 px wide,
  medium 480 to 959 px, wide 960 px and up; short under 560 px tall.
- Nothing overflows or gets cut at 350x480, 350x640, 350x960,
  380x654, 500x640, 800x640, or 1392x960.
- Text is at least 12 px, and sentences at least 14 px.
- Keep every number on the same line as its unit, and never split a
  word across lines.
- A swipe or wheel over the widget must still scroll the dashboard,
  so don't set overscroll-behavior: none.

Quality
- English copy in sentence case.
- Nothing animates when data arrives, and reduced motion is
  respected.
- Drawings and charts have role="img" with an aria-label that states
  the current values.
To use it with your own charger:
- Name the charger in the prompt, as in step 2. Change the
locationtag and the variable names under Data to match your device. - Include
charger_commandin the widget's Data sources. The buttons write it, and a write to a variable outside the data sources is dropped without an error. - In the widget's Run analysis when sending data field, select an Analysis that sends each command to the charger. The widget keeps the button busy until
statusreports the new state. If no confirmation arrives within 20 seconds, it says so and enables the button again. See Building SCADA-style HMIs with Custom Widgets for the command path. - Test the buttons with a non-production device before connecting a real charger.
When to use the development Skill
Consult the Custom Widget Development Skill when you need to:
- Inspect or edit the generated source.
- Build through an IDE or another AI client connected to the TagoIO MCP Server with a profile token.
- Investigate build, rendering, or data-integration problems.
The Skill contains the implementation requirements, supported dependency versions, SDK usage, upload constraints, and technical troubleshooting guidance. Refer to it directly rather than relying on copied examples of those requirements.
If you use another AI coding assistant, install the Skill as described in the MCP Server README, then ask the assistant to follow it before creating or changing the widget.