AI usage statistics
AI usage statistics show what your account spends on AI and how many requests it makes. You can read them for the whole account or for a single profile, and break them down by model over any period within the available time windows.
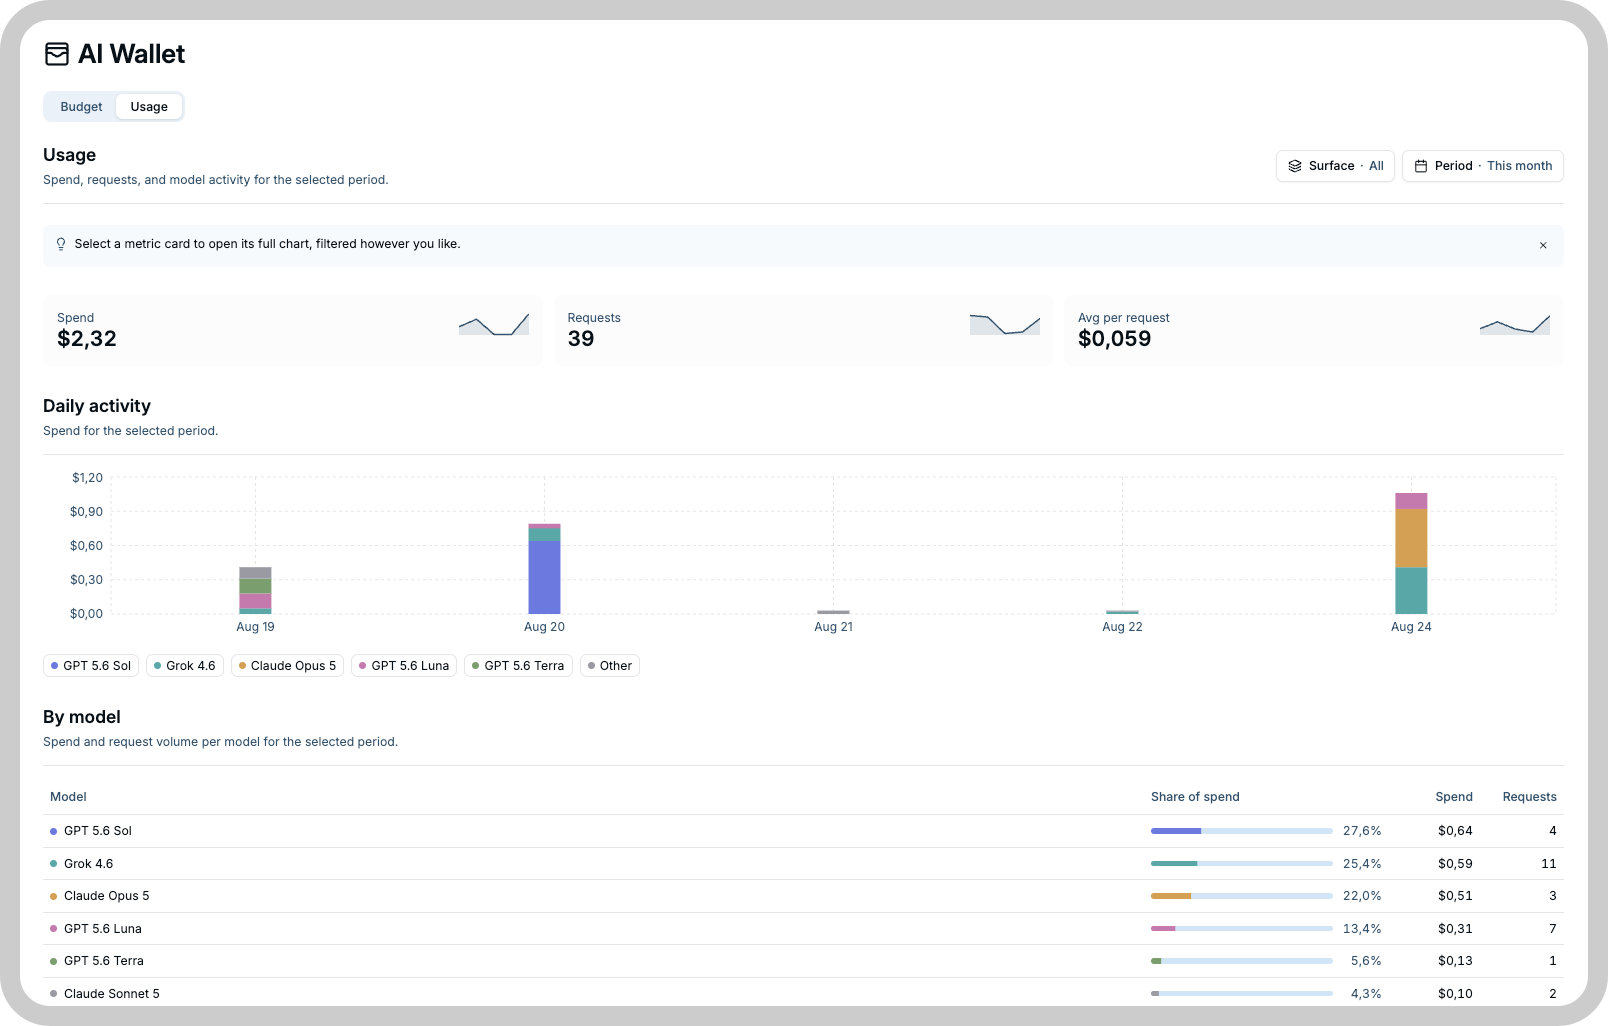
Usage covers every AI request, not only the paid ones. Free and own-provider requests appear in the request counts with a spend of zero, so you can see total activity next to what it costs.
What you can see
- Summary: total spend and total requests for the selected period.
- Activity over time: spend and requests per hour, day, or month, so you can spot when usage grew.
- By model: spend and requests per model, which shows where the money goes.
Statistics report spend and request counts only. Token counts are not exposed. To reason about token cost, use the per 1M token rates in the model catalog.
A request appears in the statistics when it finishes, and the wallet debit for a catalog model lands at the same time. A request that was interrupted or failed partway is still recorded, with the tokens it actually consumed.
Filters
Use the filters to answer different questions:
- Profile: which profile generated the usage?
- Model: which model received the requests?
- Billing type: was the request free, charged to AI Credits, or sent to your own provider?
- Surface: did the request come from chat, AI Dashboard generation, or AI Chat in TagoRUN? The dashboard surface counts generate and refine requests only; loading data on a dashboard is not an AI request.
Select a reporting period
The maximum range depends on the selected periodicity:
| Periodicity | Maximum range |
|---|---|
| Hour | 1 month |
| Day | 3 months |
| Month | 12 months |
Ranges are measured in whole calendar months rather than fixed day counts. Asking for a longer range than the periodicity allows returns an error naming the limit, so switch to a coarser periodicity to cover more time.
To request a custom range, set both the start and end dates. If either date is missing, the statistics use the default range for the selected periodicity.
Default ranges
When no dates are selected, the range ends at the current moment:
- Hourly statistics cover the previous 24 hours.
- Daily statistics cover the previous 3 calendar months: the range starts on the same day of the month, three months earlier.
- Monthly statistics cover the previous 12 calendar months, on the same rule.
On August 27, for example, daily statistics with no dates cover May 27 up to the current moment. The current hour, day, or month can contain partial data.
Compare usage with wallet history
On TagoIO Cloud, the usage statistics explain where AI Credits were spent. The wallet history explains how credits entered or left the wallet.
Use:
- Usage statistics to review requests and spending by profile, model, and feature.
- Wallet history to review purchases, expirations, support adjustments, and spending debits.
On TagoDeploy instances, spend is a meter rather than a debit: it reports the catalog value of paid-model usage, but no credits exist and TagoIO charges nothing for it. See TagoDeploy behavior.