Console for Debug
Use the console to monitor the variables and status of your script. You can see any errors or text generated by console.log (or context.log). This console is a simple and useful debugging tool.
Console UI
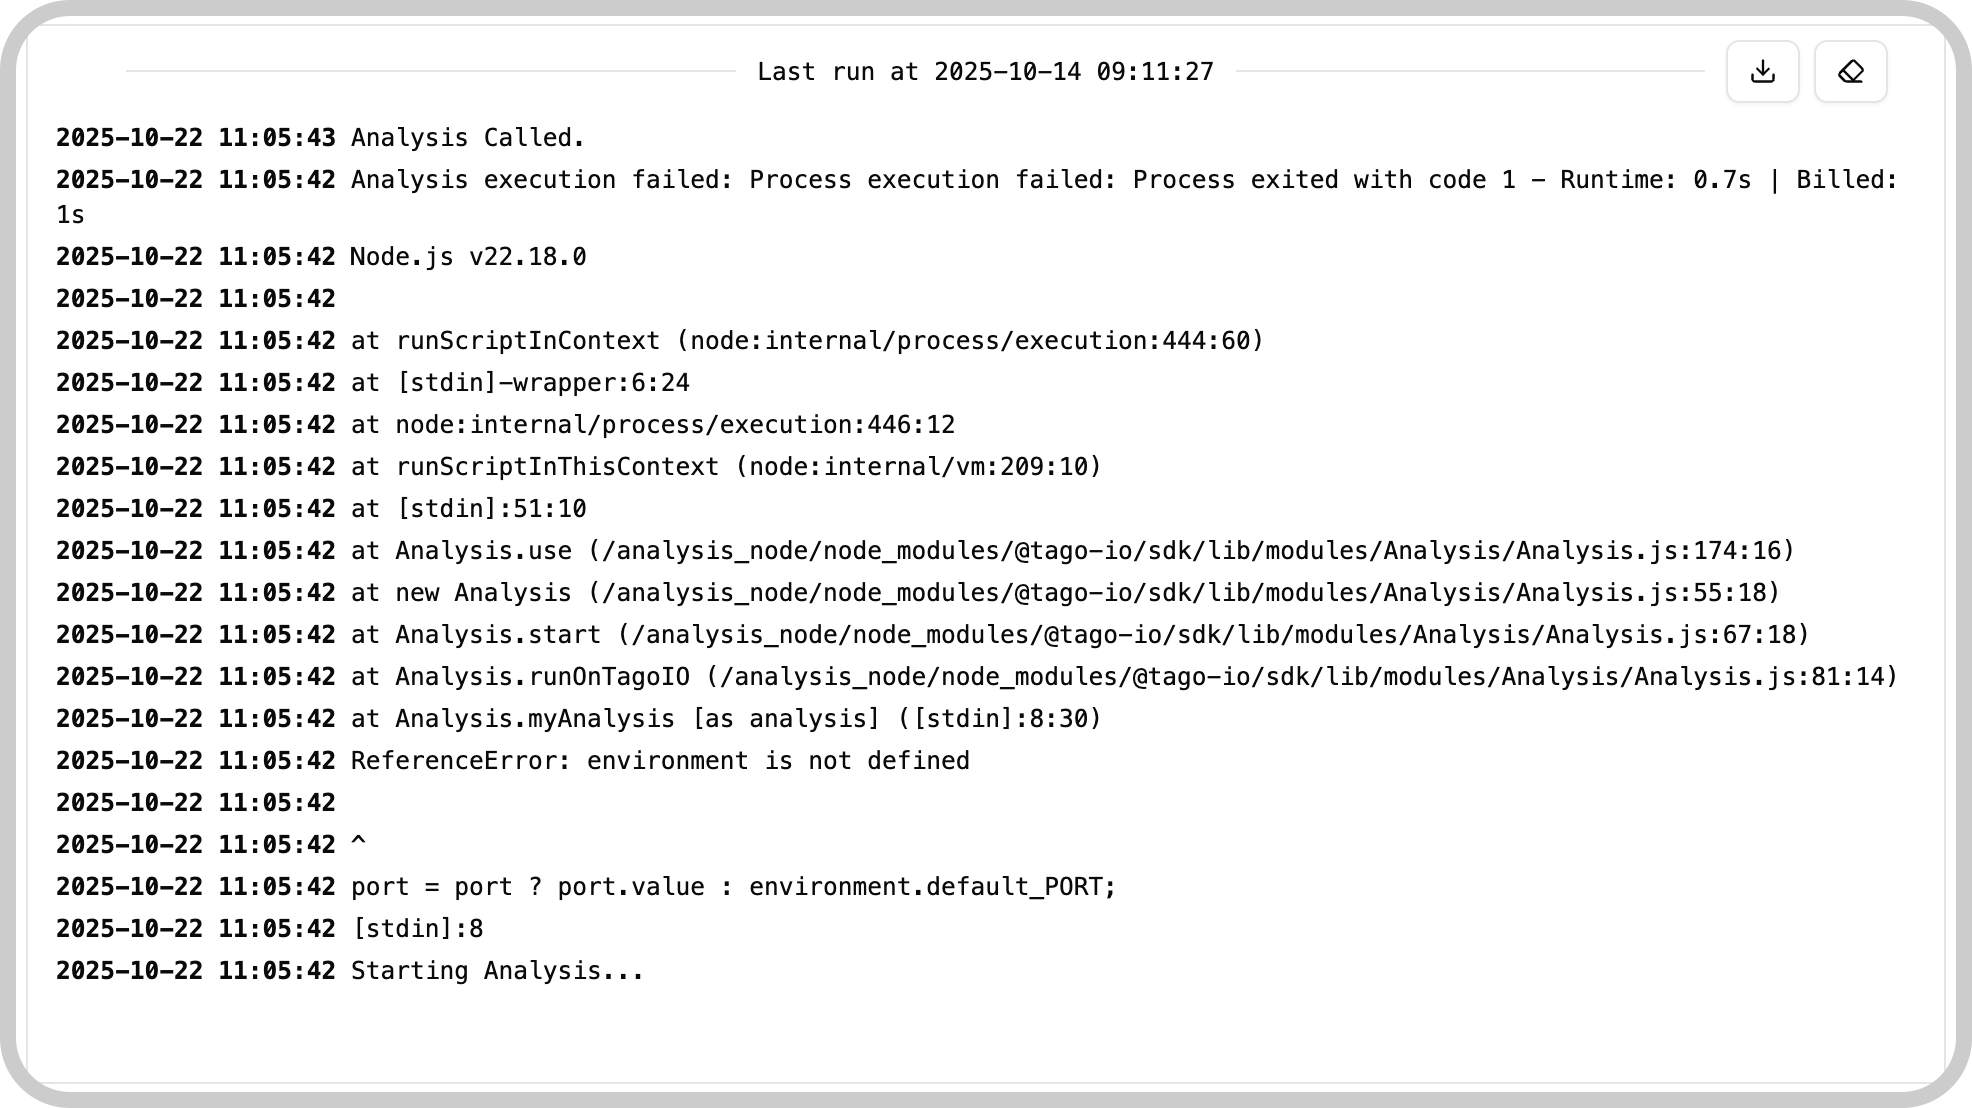
- Console Area: displays errors and any output generated by your script.
- Clear Button: clears all output shown in the console area.
- Download Button: downloads the console output as a text file.
tip
TagoAI can also help debug your script — ask about errors or unexpected behavior and it will use the Analysis console as context.
How it works
- Console Screen: any errors or responses generated by console.log (or context.log) will appear here.
- Clear Console: clears everything currently shown in the console screen.
- Download Console: downloads the console output as a text file.
Example
Use console.log in your Analysis script to write to the console:
console.log("Debug message:", myVariable);
You can learn more about Analysis here.
Something missing from this page?