Executing Queries
Running a saved query is one request: you send its id, optionally with values for its parameters, and you get a table back. A query must be stored before it can run: store it once, then execute it by id. Storing is what validates the query against your plan, records its version history, and gives it the identity an Access Management grant matches. Full request and response schemas are in the TagoIO API reference under SQL Queries.
Run a stored query
POST /sql/{id}/execute
profile-token: <profile-token>

{ "params": [{ "key": "$1", "value": "40" }] }
The body is optional: a bare POST runs the query with its stored defaults and the cache enabled. Values
you send override the stored defaults per parameter (see Parameters).
While developing, add "test": true to run the query with the cache out of the picture: no cached result is
read, and the run leaves the cache untouched for everyone else. Test mode is not a limit bypass, so rate
limits and usage metering still apply.
Exploring and iterating
There is no unsaved execution. To explore, store a scratch query and iterate on it with PUT /sql/{id}:
each content change snapshots a new version, so nothing is lost while you refine
it. Combine with test mode to keep the cache untouched while you experiment.
Query many devices
The fleet function device_data_by_tag returns the latest reading per device across every device matching
your tags (see Available Tables). Last temperature of every sensor, in
one request:
SELECT device, device_name, variable, value, time
FROM device_data_by_tag('type', 'sensor') AS f
WHERE variable = 'temperature' AND time > $1
ORDER BY device
Store it once, then execute with the time bound as a parameter
({ "params": [{ "key": "$1", "value": "2026-07-11T00:00:00Z" }] }).
One row per device comes back, each carrying that device's newest reading. Swap temperature for
location or battery to build the other fleet widgets.
Fleet queries return up to your plan's device cap per request. For larger fleets, page with the
after_device body field: order by device, then pass the last device id you received to fetch the next
page.
{
  "params": [{ "key": "$1", "value": "2026-07-11T00:00:00Z" }],
  "after_device": "LAST_DEVICE_ID_FROM_PREVIOUS_PAGE"
}
Each page is cached independently, so a dashboard paging a warm fleet stays on cache hits.
What you get back
{
  "status": true,
  "result": {
    "columns": [
      { "name": "variable", "type": "string" },
      { "name": "value", "type": "number" },
      { "name": "time", "type": "timestamp" }
    ],
    "rows": [{ "variable": "temperature", "value": 41.2, "time": "2026-03-30T10:00:00+00:00" }],
    "row_count": 1,
    "execution_ms": 12,
    "served_from_cache": false
  }
}
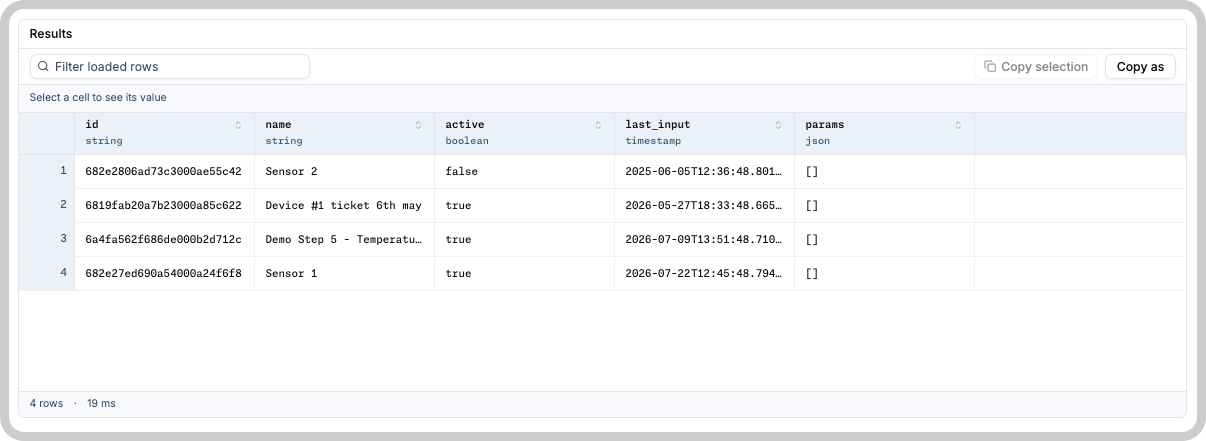
columns gives you the typed header, ready for a table or chart; rows holds the data keyed by column
name. Results are never silently shortened: row_count is the true size of what you asked for, and a query
whose result would exceed your plan's
row cap fails with a clear error
instead.
Caching
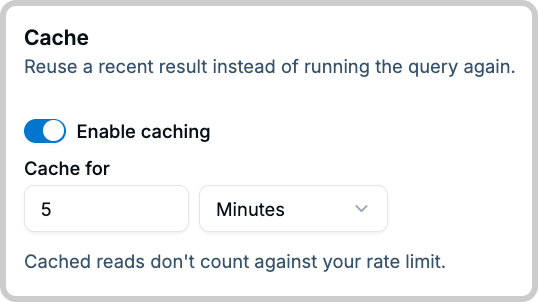
For queries that run often with the same inputs, like a dashboard widget or a public report, enable the
cache on the stored query (cache_enabled plus a cache_ttl_seconds). Then:
- Repeat executions with the same parameter values are served from the cache: fast, free of data output usage, and allowed far more requests per minute than fresh executions.
- Each distinct set of parameter values gets its own cache entry, so different inputs never mix. In a query with session functions, the resolved session values join the cache identity the same way, so results are cached per user.
- Editing the query drops its cached results automatically.
- When many callers hit an expired entry at once, only one execution runs against the database and everyone shares its result.
The response's served_from_cache field tells you which path a result took.
Soft rate limit
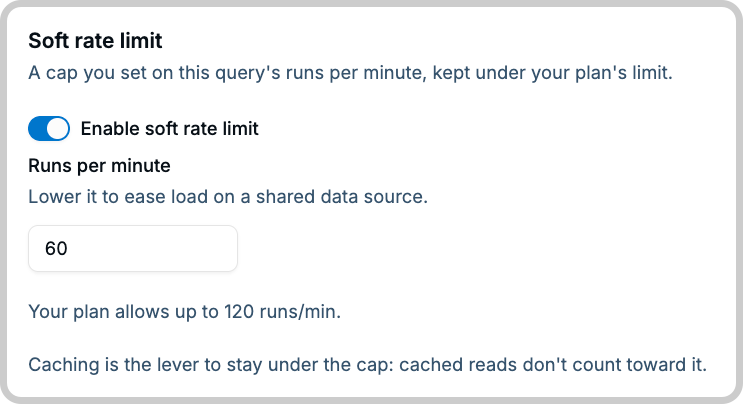
Each plan caps how many fresh executions per minute a profile can run, and cached reads get a much higher
allowance. A stored query can also set its own rate_limit_rpm, so one heavily-exposed query cannot exhaust
the whole profile's budget. The per-plan numbers and the over-limit response are in
Rate Limits.
Who can execute
- A profile token can execute any of the profile's queries.
- An Analysis or Run-user token can execute a stored query when granted the Execute permission through an Access Management policy, matched by the query's id or tags. The query then runs under the owning profile's plan and scope.
A grant authorizes running the query as-is: it returns exactly what the query selects, no more and no less. The policy never filters the rows that come back, so write the query for its audience. See Session Context for scoping one query per user. Policies themselves are set up in Access Management.