Getting Started
Each recipe below is a complete query. Copy one, replace the parts written in capitals with your own device id, variable name, or tag, and run it. You do not need to know SQL beforehand: the first time a keyword appears, it is explained in one sentence.
Ready-made examples for many other tasks are collected at snippets.tago.io.
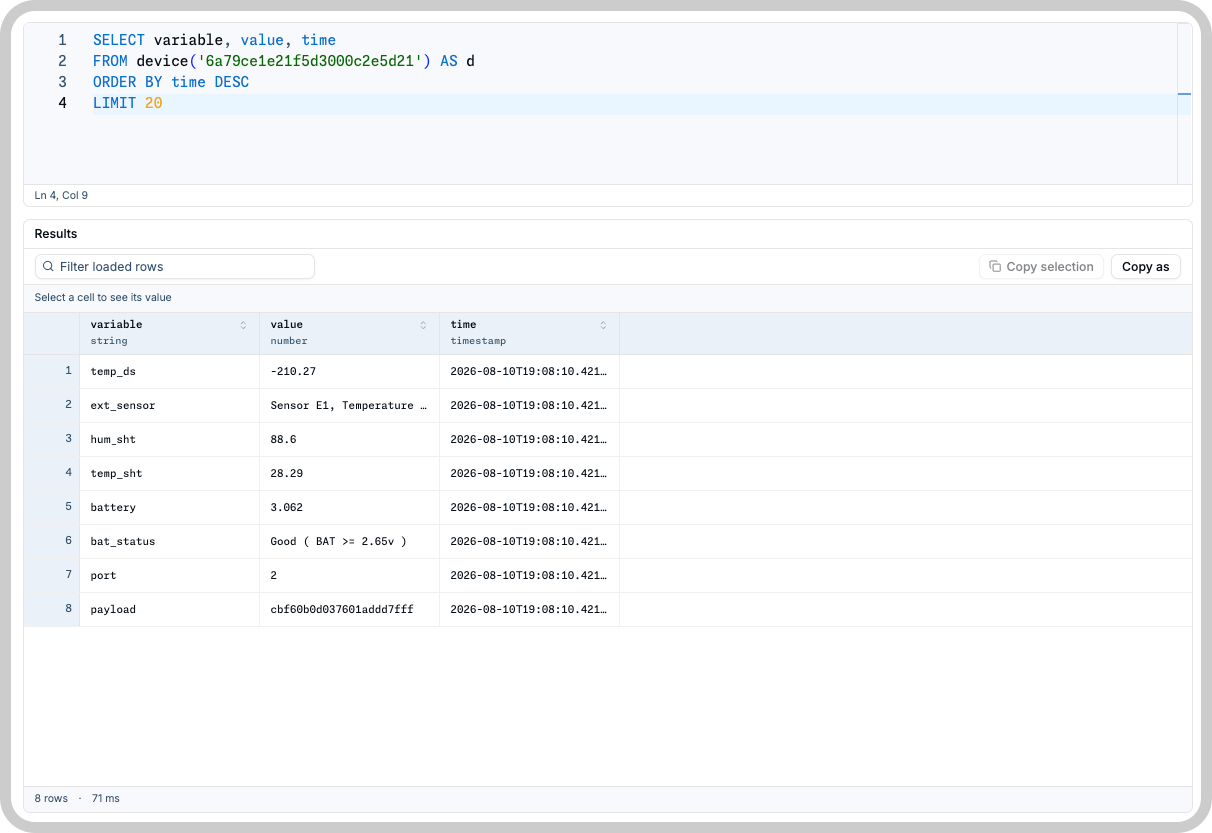
Read the last values of one device
The most common question: what has this device been sending?
SELECT variable, value, time
FROM device('DEVICE_ID') AS d
ORDER BY time DESC
LIMIT 20
SELECTlists the columns you want back. UseSELECT *to get all of them.FROM device('DEVICE_ID') AS dsays which device to read. TheAS dpart is a short nickname for that device, and it is required.ORDER BY time DESCsorts newest first (DESCfor descending,ASCfor ascending).LIMIT 20stops after 20 rows, which keeps the result small and fast.
Filter one variable over a time window
Now narrow the question down to a single variable and a period. This is the shape most charts need.
SELECT value, time
FROM device('DEVICE_ID') AS d
WHERE variable = 'temperature' AND time > $1
ORDER BY time DESC
LIMIT 100
WHERE keeps only the rows that match a condition, and AND chains conditions together. The $1 is a
placeholder: instead of writing the start date into the query, you send the value when you run it, so the
same saved query can cover today, last week, or last month. Save a default with the query and override it
per run. See Parameters for the details.
List your devices and their configuration
This one does not read sensor data at all. devices() lists your devices themselves, which is what you
want for an overview of the fleet: what exists, what is active, when each device last sent data.
SELECT id, name, active, last_input, params
FROM devices() AS d
WHERE active = true
ORDER BY last_input DESC
LIMIT 100
The params column carries each device's Configuration Parameters, so one query gives you your devices with
their configuration attached: firmware version, sampling interval, or whatever keys you store there. The
full column list is on the Available Tables page.
Read the latest value across a whole fleet
To see every device at once, filter by tag instead of naming a device. device_data_by_tag returns the
newest matching reading for each device carrying the tag, so a hundred devices come back as a hundred rows
in one request.
SELECT device, device_name, value, time
FROM device_data_by_tag('device_type', 'sensor') AS f
WHERE variable = 'temperature' AND time > $1
ORDER BY device
Fleet queries always need a variable and a starting time, which is what keeps them fast. Swap
temperature for location to build a map widget, or for battery to build a health table.
Show each Run user only their own data
If a TagoRUN portal shows the same report to many users, you do not need one query per user. A session function fills in who is running the query, so each user sees only their own rows.
SELECT value, time
FROM device_data_by_tag('customer', COALESCE(session_user_tag('customer'), 'acme')) AS f
WHERE variable = 'temperature' AND time > $1
ORDER BY device
When a Run user tagged customer = globex runs this, they get the Globex devices; another user gets theirs.
The COALESCE(..., 'acme') part is the value used when you test the query yourself as the profile owner.
Session Context covers the rules and what happens when a user matches nothing.
Next steps
- Save the query you like so widgets and analyses can run it by id. See Queries.
- Run it and read the result, including caching and fleet pagination, in Executing Queries.
- Look up any table or column in Available Tables.