Metrics reference
Use this reference to choose a Data Source metric and threshold for an alert rule. Metrics are grouped by the Service and Resource selected in the rule's data source.
Each table lists the metric's unit, aggregation, meaning, and suggested trigger condition. Threshold examples are initial values to evaluate against your workload, not guarantees of acceptable performance.
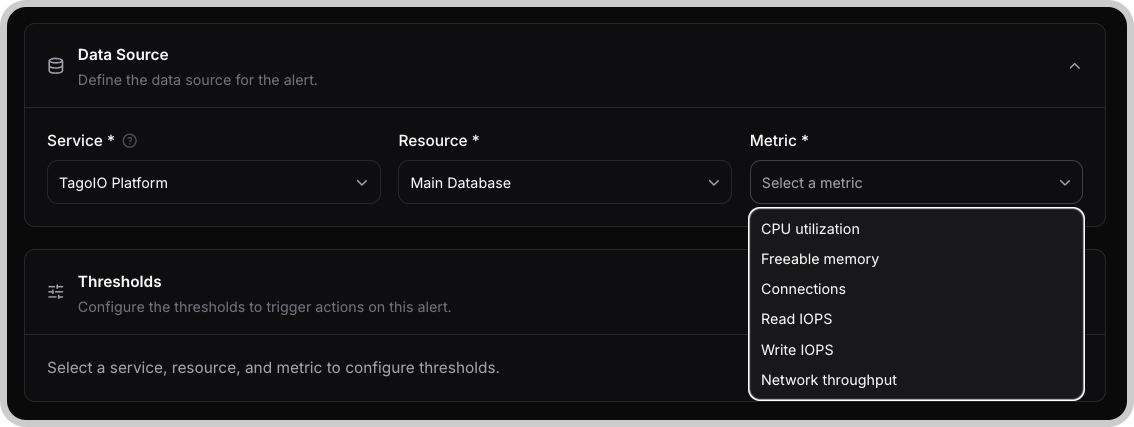
Main Database
Service: TagoIO Platform
Resource: Main Database
The managed database that stores your TagoIO data: one writer instance and the reader instances you add, all on the same machine size. Resource settings are on the Main Database page.
| Metric | Unit | Aggregation | Interpretation | Condition | Initial threshold |
|---|---|---|---|---|---|
| CPU utilization | % | Average | Database processing load from reads, writes, and queries. Compare sustained increases with workload changes. | Greater than | Warning: 80; Critical: 90 |
| Freeable memory | MB | Average | Memory available to the database instance. Investigate sustained decreases alongside workload and performance changes. | Less than | Baseline first |
| Connections | Count | Average | Database connections. Compare with normal concurrency, API instance count, and the database connection limit. | Greater than | Baseline first |
| Read IOPS | Count per second | Average | Disk read operations per second. Compare with CPU, memory, and query activity. | Greater than | Baseline first |
| Write IOPS | Count per second | Average | Disk write operations per second. Compare with ingestion volume and update activity. | Greater than | Baseline first |
| Network throughput | Bytes per second | Average | Rate of data transfer to and from the database. | Greater than | Baseline first |
A connection threshold should leave room below the database's connection limit. Do not choose it solely as a multiple of the normal connection count.
API Cluster
Service: TagoIO Platform
Resource: API Cluster
The instances that serve every request to your project's API, Admin, and TagoRUN: identical containers, one set per instance, added and removed by autoscaling on CPU. Settings are on the API page.
| Metric | Unit | Aggregation | Interpretation | Condition | Initial threshold |
|---|---|---|---|---|---|
| CPU utilization | % | Average | Processing load across API instances. Compare with the autoscaling target and configured instance range. | Greater than | Warning: 80 |
| Memory utilization | % | Average | Memory usage across API instances. Compare increases with request volume and the size of datasets being processed. | Greater than | Warning: 80 |
In-Memory Database
Service: TagoIO Platform
Resource: In-Memory Database
The managed in-memory cache that serves real-time data: one primary node and the reader replicas you add. Replicas serve reads. Settings are on the In-Memory Database page.
| Metric | Unit | Aggregation | Interpretation | Condition | Initial threshold |
|---|---|---|---|---|---|
| CPU utilization | % | Average | Processing load on the cache. | Greater than | Warning: 80 |
| Freeable memory | MB | Average | Memory available to the cache instance. Compare sustained decreases with normal usage. | Less than | Baseline first |
| Cache hits | Count | Total | Successful cache reads during the window. Compare changes with request traffic and workload patterns. | Less than | Baseline first |
| Network inbound | Bytes | Total | Data received during the window. | Greater than | Baseline first |
| Network outbound | Bytes | Total | Data sent during the window. | Greater than | Baseline first |
Installed apps: Compute
Service: The installed app's name
Resource: Compute
Every installed app (MQTT broker, middleware, custom Docker container, web service) runs as its own containers in the project's private network and exposes the CPU and memory of its instances, averaged across them. Machine size and instance range are set on the app's Instances page, such as MQTT Instances.
| Metric | Unit | Aggregation | Interpretation | Condition | Initial threshold |
|---|---|---|---|---|---|
| CPU utilization | % | Average | Processing load across app instances. Compare sustained increases with the autoscaling target, instance count, and workload. | Greater than | Warning: 80 |
| Memory utilization | % | Average | Memory usage across app instances. Investigate sustained high values against workload and application behavior. | Greater than | Warning: 80 |
High utilization is a reason to investigate, not proof that a larger machine is the only solution. Review workload changes and application behavior along with capacity settings.
Account: Billing
Service: Account
Resource: Billing
Select Budget and enter Budget (USD) on the alert rule. Thresholds represent percentages of that configured amount.
| Metric | Unit | Measurement | Interpretation | Condition | Initial threshold |
|---|---|---|---|---|---|
| Budget | % of Budget (USD) | Latest month-to-date spending total, refreshed about hourly | Accumulated spending as a percentage of the rule's budget. | Greater than | Warning: 70; Critical: 90 |