Setting up Monitoring
Set up Monitoring to notify your team when a metric crosses a threshold you define. Start by installing the app, choosing where to send notifications, and creating a Main Database CPU alert.
Before you start
You need:
- A TagoDeploy project with the TagoIO Platform deployed. Rules can also watch installed apps such as an MQTT broker or a middleware.
- A way to receive alerts: a SendGrid account or an SMTP relay for email, a Twilio account for SMS, or a webhook URL such as a Slack or Google Chat incoming webhook.
Step 1: Install the app
Monitoring is installed per project from the App Catalog. Its rules and actions belong to that project.
- Open Apps in the top navigation and find Monitoring. Look under Others, or search for it by name.
- Click the card, review the overview, and click Next.
- Under Installation, choose In a project and select the project to monitor. The region comes from the project. Select the version marked Latest.
- Review the Specifications and continue to the Installation Summary.
- Review the summary and payment details, then complete the payment step.
The app provisions in the background. When it is ready, a Monitoring tab appears in the project, with Overview, Alerts, Actions, and Logs in its sidebar.
Step 2: Create an action
An action defines where Monitoring sends a notification and what the message contains. Create the action first, then attach it to your alert rule.
- In the Monitoring sidebar, open Actions and click New action.
- Enter a descriptive name, such as "Ops email" or "Slack #alerts".
- Choose the Type. You cannot change it after creating the action.
- Configure the selected type using the instructions below.
- Click Save.
If you monitor several projects, include the project or customer name directly in the message template so recipients can identify the source.
Email
Choose SendGrid or SMTP and enter the provider settings:
- SendGrid: Enter an API key and use a verified sender address.
- SMTP: Enter the host and port, plus a username and password if required. Turn Secure connection on for a relay that encrypts from the start of the connection, usually on port 465. Leave it off for a relay that upgrades the connection to encryption after connecting, usually on port 587.
Set the From Address and one or more To Addresses, then write the Subject and Body.
Monitoring stores its own credentials. Enter the SendGrid API key here even if the project already uses SendGrid under Integrations.
For example, use this subject:
[{thresholdName}] {serviceName}: {metricName} at {metricValue}
Webhook
Set the URL, Method, optional Authentication, and Body in JSON or text.
For a Slack incoming webhook, use POST with a JSON body:
{ "text": "[{severity}] {serviceName}: {metricName} at {metricValue}" }
SMS (Twilio)
Enter the Account SID, Auth Token, From Number, and one or more To Numbers. Write the notification in Message Template.
Message variables
Use variables such as {serviceName}, {metricName}, and {metricValue}
to identify what triggered the notification. See
Actions for the full list
of variables and action settings.
Step 3: Create your first alert rule
Create a Main Database CPU rule with Warning and Critical thresholds.
-
Open Alerts and click New alert.
-
Under General:
- Name the rule "Main Database CPU".
- Leave Enabled on.
- Select your action under Default actions.
- Leave Cooldown at 300 seconds.
-
Under Data Source, select:
- Service: TagoIO Platform.
- Resource: Main Database.
- Metric: CPU utilization.
-
Under Thresholds, click New threshold twice and configure:
Name Severity Trigger condition Value Warning Warning Greater than 80 Critical Critical Greater than 90 CPU utilization is measured as a percentage. Greater than triggers when the value is at or above the configured number; Less than triggers when it is at or below.
Leave Actions empty on both thresholds to use the rule's default actions.
-
Click Save.
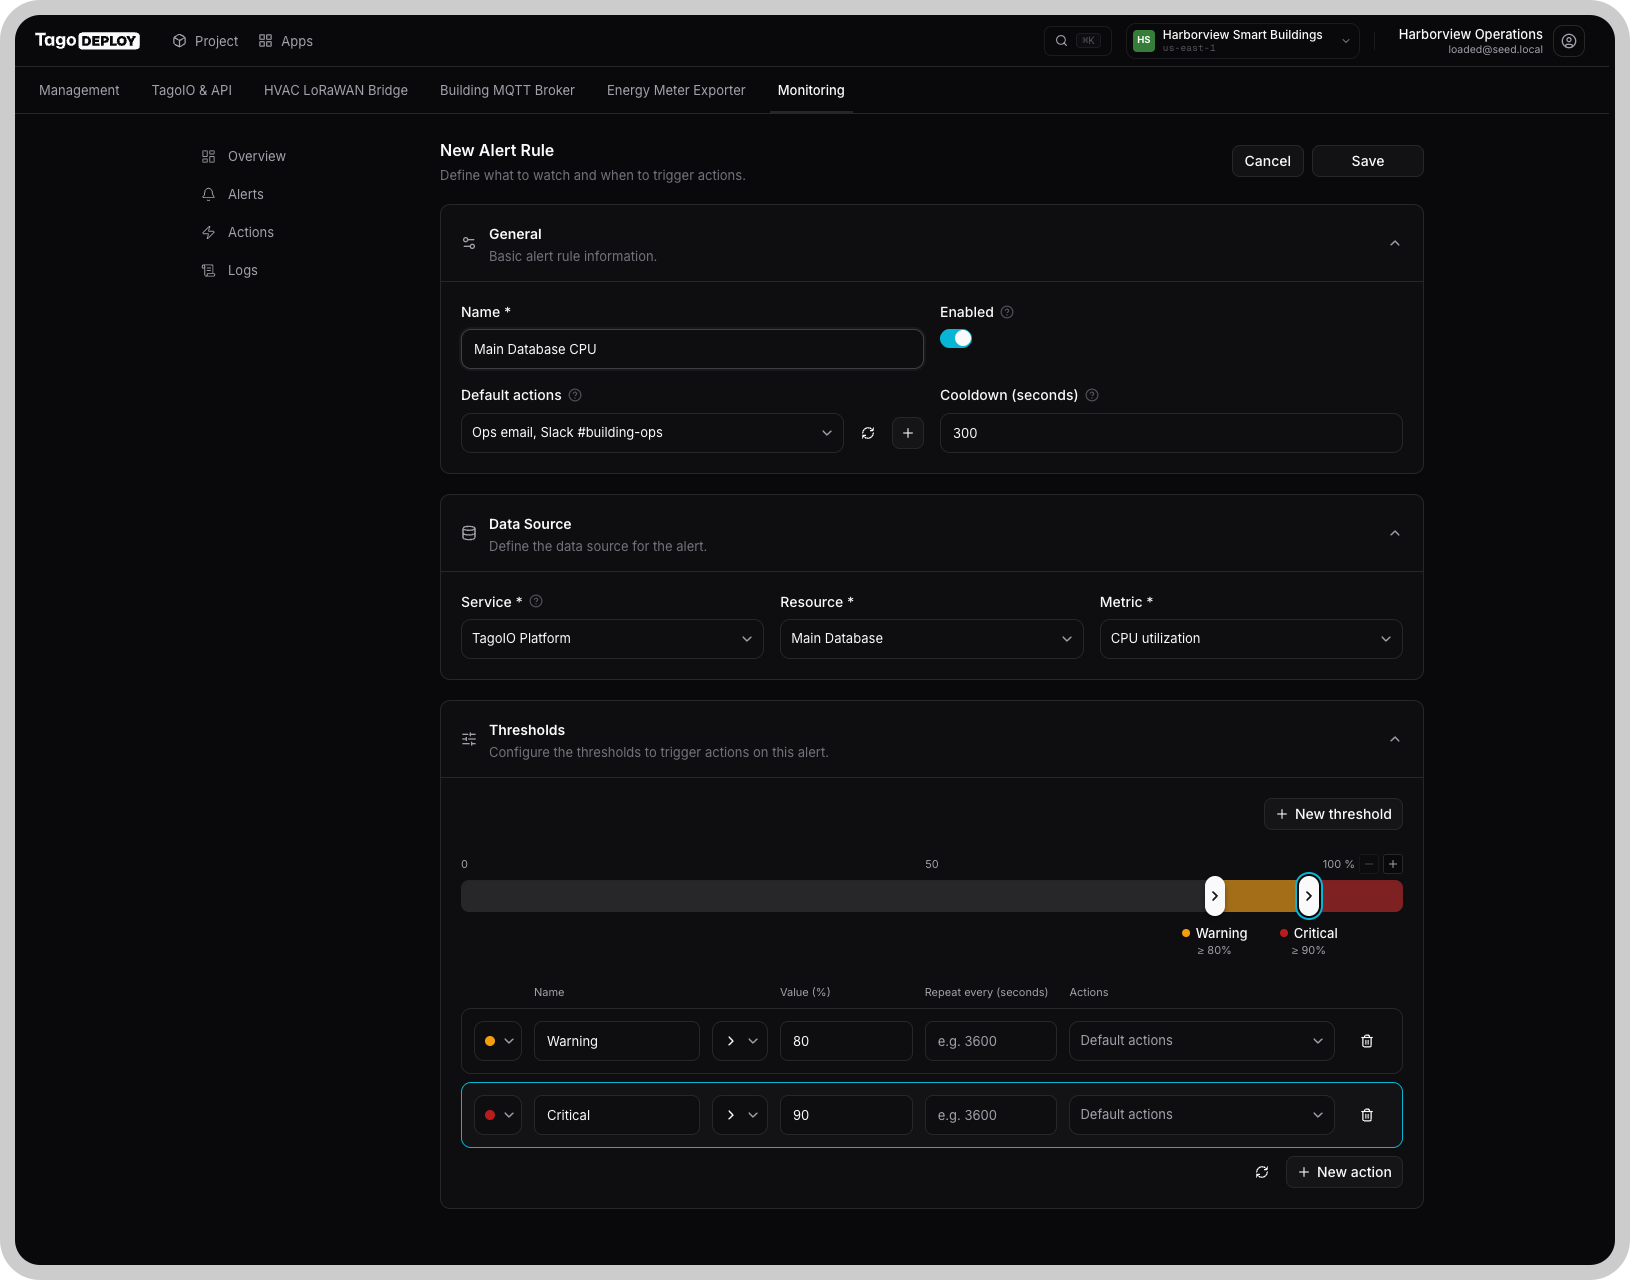
The rule starts running shortly after you save. Monitoring checks it every 5 minutes; no project deployment is needed. Saving the rule does not itself send a notification.
Step 4: Check that the rule runs
Open Logs after Monitoring has had time to check the rule. Look for Check Completed entries for Main Database CPU and review the reported values.
If CPU usage remains below the configured thresholds, no alert is expected. A completed check confirms that Monitoring is evaluating the rule, but it does not confirm that your notification provider can deliver a message.
When a threshold triggers, review the action run in Logs and confirm that the message reaches its destination. For help investigating an alert, see Responding to alerts.
Additional rules to consider
Add rules based on the resources your project uses. The values below are starting points, not requirements for every project.
| Rule | Data source | Starting thresholds |
|---|---|---|
| Main Database CPU, created above | TagoIO Platform → Main Database → CPU utilization | Warning: Greater than 80%. Critical: Greater than 90%. |
| Main Database memory | TagoIO Platform → Main Database → Freeable memory | Critical: Less than a value below the usual low for this resource. Establish a baseline before choosing the value. |
| API Cluster CPU | TagoIO Platform → API Cluster → CPU utilization | Warning: Greater than 80%. |
| In-Memory Database memory | TagoIO Platform → In-Memory Database → Freeable memory | Critical: Less than a value below the usual low for this resource. Establish a baseline before choosing the value. |
| App compute CPU, one rule per installed app | The app → Compute → CPU utilization | Warning: Greater than 80%. |
| Monthly budget | Account → Billing → Budget | Enter a budget in Budget (USD). Warning: Greater than 70%. Critical: Greater than 90%, with Repeat every (seconds) set to 86400 on the Critical threshold. |
For memory rules, review a representative period of resource usage before choosing a threshold. Check the metric's unit before entering the value.
The Metrics reference explains each metric and its unit.
What happens when a rule fires
Monitoring runs the configured actions and displays the alert under Active Alerts on Overview. The notification content depends on the subject, body, or message template you configured.
The alert stays active until the metric returns to the normal side of the threshold. Monitoring records the recovery in Logs. By default, notifications do not repeat while the alert remains active. Configure Repeat every on a threshold if you need reminders.
Resolve alert in the Alert activity row menu closes the alert record. It does not disable the rule or fix the underlying condition.
To investigate, sign in to TagoDeploy and open the project's Monitoring tab. See Responding to alerts for guidance on what to check and change for each metric.